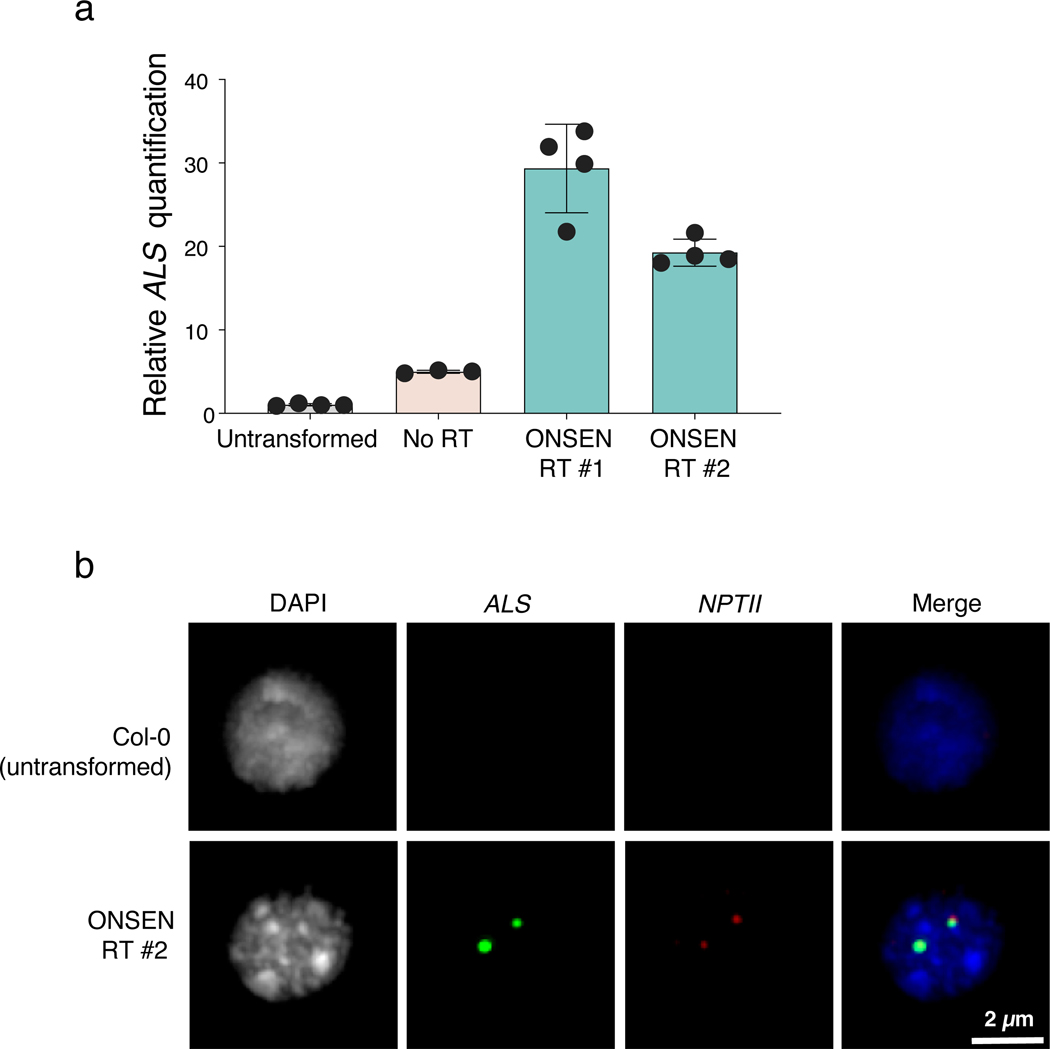
Extended Data Figure 1. DNA FISH analysis.
a. DNA q-PCR of ALS in Col-0 (untransformed) and T1 plants used for the FISH experiment (panel b and Fig. 1e). Dots represent DNA samples from individual leaves from the same T1 plant (n = 4 for Col-0, ONSEN RT #1 and ONSEN RT #2, n = 3 for No RT). Horizontal bars indicate the mean. SD is shown. b. FISH in leaf nuclei targeting the T-DNA sequence. Nuclei were stained with DAPI and probes for ALS (green) and NPTII (red). FISH experiment was performed >3 times with similar results.

