
FIGURE 5.
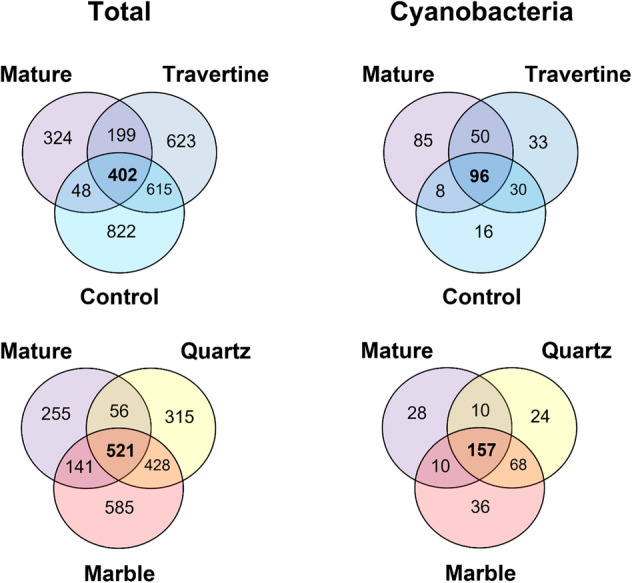
Venn diagram showing the number of shared ASVs between sample type, across the 2022 inland array dataset. Both total number of shared ASVs and number of shared Cyanobacteria ASVs were calculated.
Official websites use .gov
A
.gov website belongs to an official
government organization in the United States.
Secure .gov websites use HTTPS
A lock (
) or https:// means you've safely
connected to the .gov website. Share sensitive
information only on official, secure websites.
Venn diagram showing the number of shared ASVs between sample type, across the 2022 inland array dataset. Both total number of shared ASVs and number of shared Cyanobacteria ASVs were calculated.