
FIGURE 7.
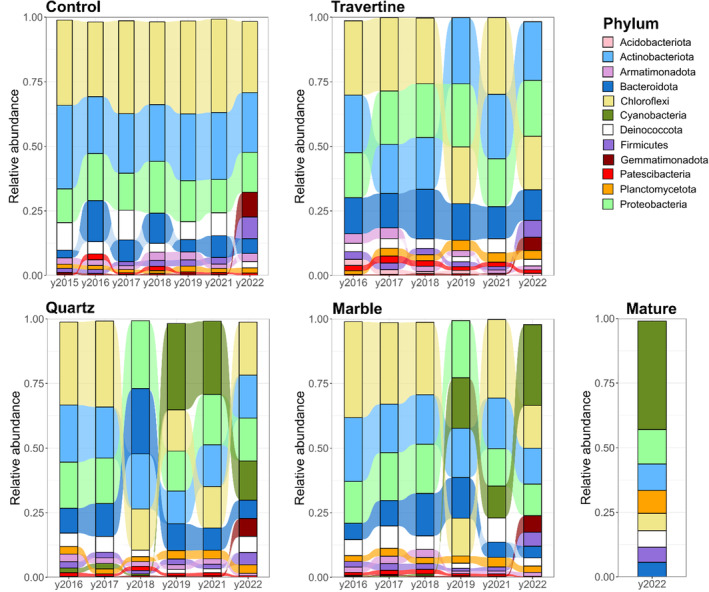
Alluvial plots showing the relative abundance of dominant phyla in samples across the station array. Samples were grouped according to rock type and year. Dominant phyla represent those phyla that account for more than 1% of total reads across the sample set. Relative abundance is expressed as the fraction of total reads. In barplots for each year, phyla are arranged in decreasing order of abundance, from the phylum with the highest relative abundance on top, to the phylum with the lowest relative abundance. Samples were clustered according to the following nomenclature: Control – samples collected from open soil; Travertine – samples taken from soil under travertine rocks; Quartz – samples collected from ventral surface of the quartz rocks and from soil underneath; Marble – samples collected from the ventral surfaces of the marble rocks, and the soil underneath; Mature – Samples collected from the ventral surfaces of quartz rocks occurring naturally at the site of the station array.