
FIGURE 8.
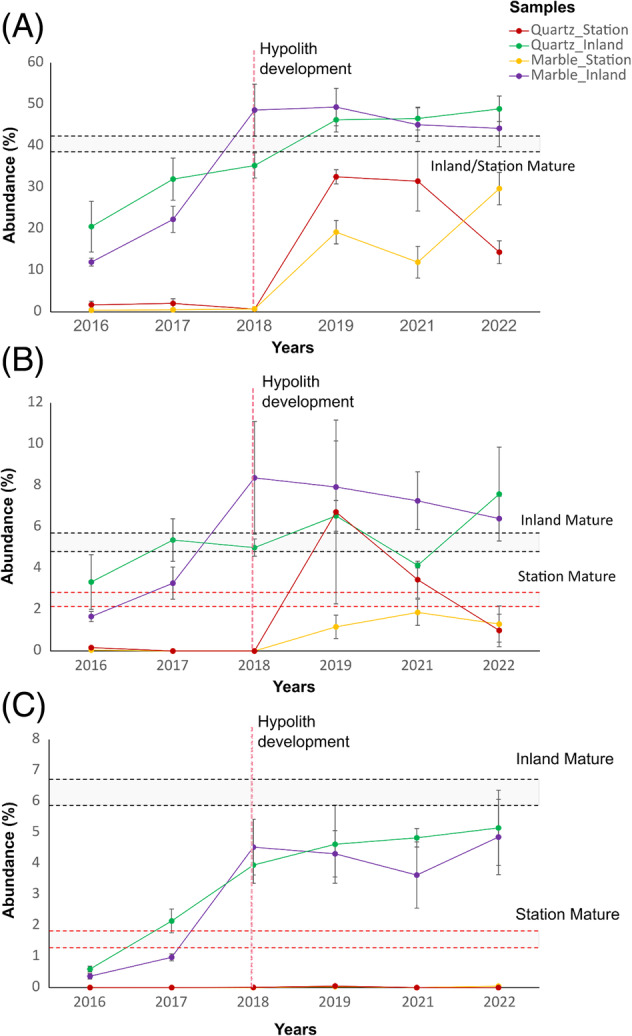
Comparison of the growth dynamics of Cyanobacteria between Marble and Quartz samples at the inland and station arrays. The line graphs represent the shifts in relative abundance (%) of the phylum Cyanobacteria (A), as well as the genera Coleofasciculus PCC‐7420 (B) and Lyngbya PCC‐7419 (C), as a function of sampling year, for Quartz and Marble samples in both station and inland arrays. The vertical dashed line represents the sample time point at which we obtained visual evidence of microbial attachment to the rocks at the inland array. Black and red dashed lines indicate the relative abundance ranges observed in mature hypoliths from inland and station arrays, respectively, for each represented taxon. In the case of the phylum Cyanobacteria, both the mature hypoliths of the inland and station arrays exhibited overlapping relative abundance ranges, and therefore were combined into a single range. The error margins for each time point were calculated as the standard deviation divided by the square root of the number of samples.