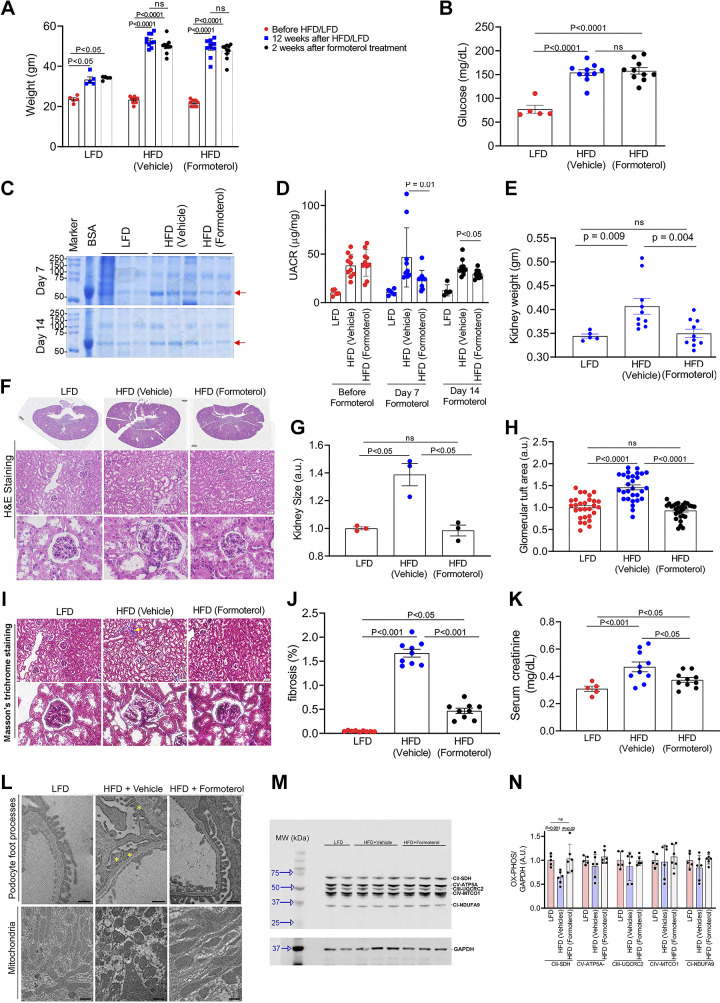
Figure 2.
Formoterol treatment results in recovery from high-fat diet (HFD)-induced diabetic renal injury. A: HFD induced a significant increase in body weight compared with a low-fat diet (LFD). B: overnight fasting glucose levels were found to be significantly higher in mice that received the HFD compared with the LFD. C: SDS-PAGE of urine samples after 7 and 14 days of formoterol treatment showed a decrease in albumin excretion in HFD mice treated with formoterol compared with HFD mice treated with vehicle alone. Red arrow points to albumin. BSA, bovine serum albumin. D: measurement of urine albumin to creatinine ratio (UACR) by ELISA showed a significant reduction in albuminuria at 7 and 14 days in HFD mice treated with formoterol compared with HFD mice treated with vehicle alone. E: HFD mice had a significantly increased kidney weight compared with LFD mice, and this was reversed with formoterol treatment. F: histology, hematoxylin and eosin (H&E) staining, of kidney sections in LFD, HFD, and HFD + formoterol mice. Bar in the full kidney sections = 800 μm. Bar in middle row = 50 μm. G and H: quantitative analysis of kidney size and glomerular tuft area showed that both were increased in HFD mice compared with LFD mice and that formoterol treatment decreased these parameters back to what was seen in LFD mice. I: histology and Masson’s trichrome staining of kidney sections in LFD, HFD, and HFD + formoterol mice examining fibrosis. Yellow arrow points to fibrosis in blue. Bar in top row = 50 μm. J: quantitative analysis showing increased fibrosis in kidneys of HFD vs. LFD mice, which was largely reversed with formoterol. K: serum creatinine increased in HFD mice compared with LFD mice and decreased with formoterol treatment. L: representative EM sections show podocyte foot process effacement (yellow *) in HFD mice but not in LFD or HFD + formoterol mice. Mitochondria were rounded in HFD mice as opposed to oblong in LFD and HFD + formoterol mice. Bar = 800 nm. M: markers of mitochondrial biogenesis in kidney lysates were evaluated by Western blotting using OXPHOS (cocktail antibodies of mitochondrial electron transport chain complex I to V) and GAPDH antibodies. GAPDH is a loading control. N: quantitative analysis showing that complex II was significantly decreased in HFD mice compared with LFD mice, and levels were restored in HFD + formoterol mice. ns, nonsignificant. All data are presented as means ± SE. These experiments were repeated twice with similar results. For F, I, and L, representative sections are shown. For C, G, M, and N, representative experiments are shown with each dot representing a mouse. For A, B, D, E, J, and K, data from all the experiments were aggregated with each dot representing a mouse. For glomerular tuft area in H, three measurements from each mouse were used. EM, electron microscopy.

