Figure 4.
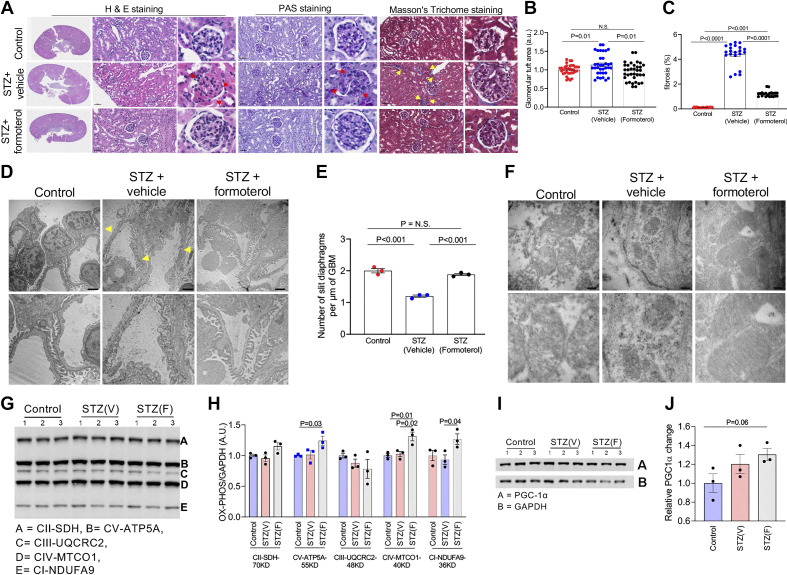
Formoterol treatment resulted in recovery from streptozotocin (STZ)-induced diabetic renal injury. A: representative images from H&E, PAS, and Masson’s trichrome staining of sections from paraffin-embedded renal tissue. Histological analysis showed that formoterol treatment reduced fibrosis (yellow arrows) in STZ-treated mice compared with mice treated with vehicle alone. STZ mice had nodular lesions typical of diabetic nephropathy (red arrows). Formoterol treatment reversed these changes. Scale bar = 50 μm. B: quantitative analysis of the glomerular tuft area demonstrated a significant reduction in formoterol-treated mice compared with mice treated with vehicle alone. C: formoterol treatment in STZ-treated mice mice showed a significant reduction in fibrosis compared with mice treated with vehicle alone. All data are presented as means ± SE. D: representative TEM images of podocyte foot processes in control, STZ + vehicle, and STZ + formoterol-treated mice. Foot processes appeared effaced and GBM thickened in STZ-treated mice (yellow arrow). Scale bar = 2 μm. E: quantitative analysis of electron micrographs showed significant reduction in the number of slit diaphragms per micrometers in STZ-treated mice, which was reversed with formoterol. F: representative EM images of mitochondria whose shape and size were distorted following STZ and restored with formoterol. Scale bar = 200 nm. G: markers of mitochondrial biogenesis in kidney lysates were evaluated by Western blotting using OXPHOS (cocktail antibodies of mitochondrial electron transport chain complex I to V) and GAPDH antibodies. H: densitometric analysis of immunoblots showed significant increases in complexes V-ATP5A, IV-MTCO1, and I-NDUFA9 proteins in STZ + formoterol-treated kidneys compared with control kidneys and in IV-MTCO1 and I-NDUFAS proteins in STZ + formoterol treated kidneys compared with STZ + vehicle- treated kidneys (P < 0.05). All data are presented as means ± SE. I and J: a trend toward increased PGC-1α expression was found in STZ animals treated with formoterol. These experiments were repeated twice with similar results. For A, D, and F, representative sections are shown. For E and G–J, representative experiments are shown with each dot representing a mouse. For glomerular tuft area in B, three sections from each mouse were used. For fibrosis measurements in C, three sections from each mouse were used. EM, electron microscopy; H&E, hematoxylin and eosin; ns, nonsignificant; PAS, periodic acid-Schiff.

