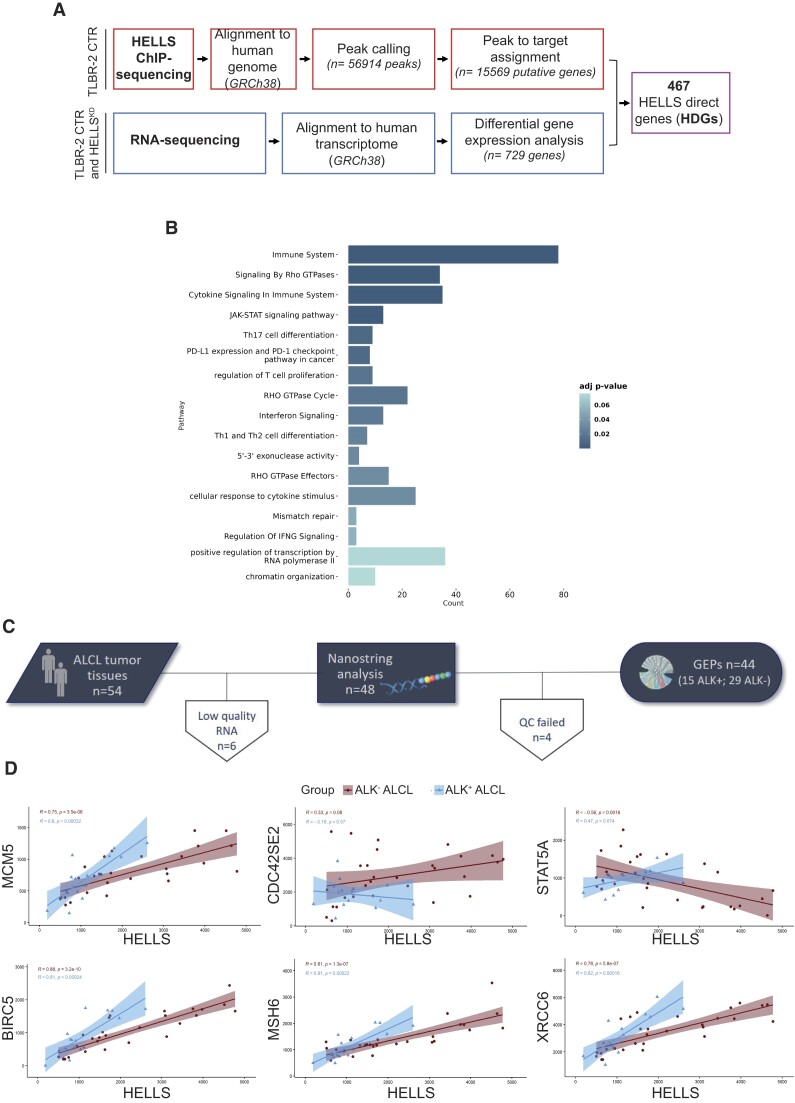
Figure 1.
Transcriptional landscape of HELLS in T-cell Lymphomas. (A) Schematic workflow for the identification of HELLS direct genes (HDGs). (B) GO enrichment bar plot of the most significantly enriched pathways (adjusted P-value < 0.05) for HDGs. Colors indicate the adjusted P-values and the size of bars is proportional to the ratio of differentially expressed genes on the total genes of the given pathway. (C) Outline of the study workflow for validating HELLS signature in the FFPE retrospective cohorts of ALCL by the nCounter platform. (D) Correlation plots of HELLS and a selection of HDGs in ALK− ALCL and ALK+ ALCL patients. For each gene pair, the expression HELLS is on the x-axis, while the expression HDGs is on the y-axis. Blue and red areas represent 95% confidence intervals.

