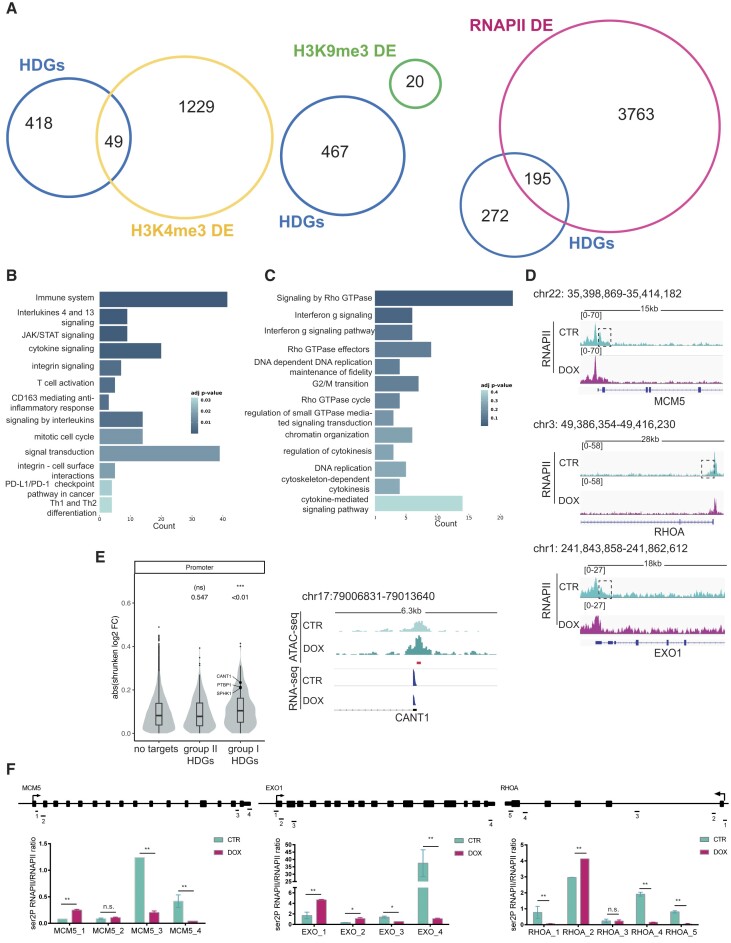
Figure 2.
Loss of HELLS alters RNAPII dynamics. (A) The Venn diagrams show the overlap, the number of genes identified in each condition, and the number of HELLS direct genes (HDGs) that are differentially enriched (DE) for the trimethylated histone H3 on Lysine 4 (H3K4me3), trimethylated histone H3 on Lysine 9 (H3K9me3) and RNA-Polymerase II (RNAPII) in TLBR-2 HELLSKD cells relative to control. (B) GO enrichment bar plots of the most significantly enriched pathways (adjusted P-value < 0.05) for HELLS direct genes (HDGs) belonging to group I (n = 195). Colors indicate the adjusted P-values and the size of the bars is proportional to the ratio of differentially expressed genes to the total of genes of the given pathway. (C) GO enrichment bar plots of the most significantly enriched pathways (adjusted P-value < 0.05) for group II of HDGs (n = 272). Colors indicate the adjusted P-values, and the size of bars is proportional to the ratio of differentially expressed genes to the total of genes of the given pathway. (D) RNAPII enrichment profile of representative HELLS direct genes in TLBR-2 HELLSKD (DOX) and control (CTR) cells. (E) The violin plot shows changes in chromatin accessibility—after HELLS KD in TLBR-2 cells—between genes that are not bound by HELLS (no targets) and groups I and II of HDGs. On top, P-values associated with beta coefficients estimated by linear regression model with log2 shrunken fold-change as the response variable, and gene groups as the independent variable (left panel). Example of an ATAC-seq and RNA-seq IGV browser view in a representative HDG in TLBR-2 control and HELLSKD. The y-axis represents the normalized tag densities relative to hg19 genomic coordinates. The red bar represents the HELLS peak (based on ChIP-seq analysis) (right panel). (F) ChIP-RT-qPCR detection of ser2P-RNAPII normalized on total RNAPII levels for HDGs in TLBR-2 cell line. Data are representative of five independent experiments and are shown as the mean ± SEM. Two-tailed t-test. *P < 0.05; **P < 0.01.

