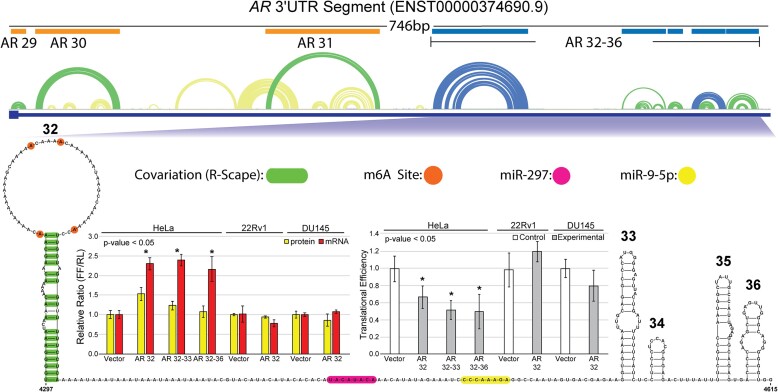
Figure 5.
AR-FL 3′UTR functional assay results. Structure function data for AR-FL 3′UTR structures 32–36. A 746 nt fragment at the beginning of the AR-FL 3′UTR is shown with ScanFold predicted structures represented as an arc diagram above the gene cartoon. Low z-score structures (blue and green arcs) are annotated with their number and a blue or orange box. Structures annotated with blue boxes are expanded and represented below the arcs as 2D models. The individual hairpins of the 2D model are numbered and annotated with all relevant data including four m6A modifications (orange circles) and eighteen covarying base pairs (green bars) on structure 32, and a miR-297 site (pink) and a miR-9-5p site (yellow) for the single stranded region between structure 32 and 33. These structures were tested for function via dual luciferase assays and qPCR in HeLa, 22Rv1 and DU145 cells. The changes in protein (yellow) and mRNA (red) levels compared to vector control can be seen in the left bar graph. Using the protein and mRNA levels, translational efficiency was calculated and plotted in the right bar graph. Asterisks represent a P-value <0.05 determined using a two-tailed student T-test.

