Fig. 2.
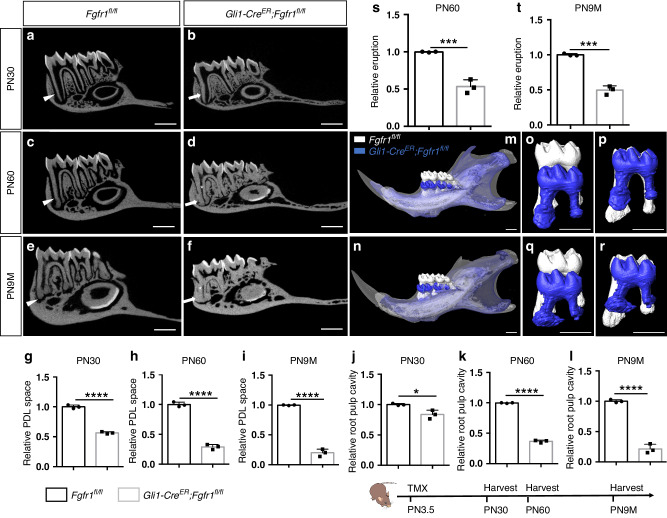
Loss of Fgfr1 in Gli1+ progenitor cells leads to tooth ankylosis. a–f MicroCT analysis of the first mandibular molars in Fgfr1fl/fl and Gli1-CreER;Fgfr1fl/fl mice at PN30, PN60, and postnatal 9 months (PN9M). White arrowheads point to the periodontal ligament space; white arrows point to the narrowed periodontal ligament space; white asterisk points to the narrowed root pulp cavity. g–i Relative periodontal ligament space in control and Fgfr1 mutant mice at PN30, PN60, and postnatal 9 months (PN9M). P < 0.000 1, unpaired Student’s t-test, n = 3 and each point represents one animal. j–l Relative tooth root pulp cavity area in control and Fgfr1 mutant mice at PN30, PN60, and postnatal 9 months (PN9M). j P = 0.017 5, k, l P < 0.000 1, unpaired Student’s t-test, n = 3 and each point represents one animal. m–n MicroCT overlays: superimposition of control (white) and Gli1-CreER;Fgfr1fl/fl (blue) mouse mandibles. o, q Overlay of the mandibular first molars of control (white) and Gli1-CreER;Fgfr1fl/fl (blue) using the mandibular border as reference. p, r Overlay of the mandibular first molars of control (white) and Gli1-CreER;Fgfr1fl/fl (blue) using the crown as reference. s, t Relative tooth eruption in control and Fgfr1 mutant mice at PN60 and postnatal 9 months (PN9M). s P = 0.000 9, t P = 0.000 2. n = 3 and each point represents one animal, with an unpaired Student’s t-test performed. Schematic at the bottom indicates the induction protocol. *P < 0.05, ***P < 0.001, ****P < 0.000 1, Scale bars, 1 mm

