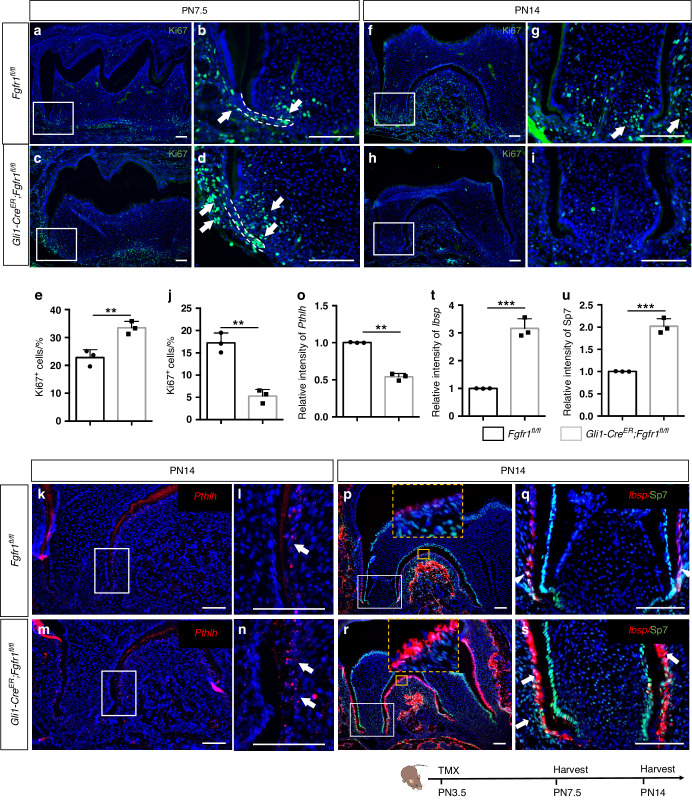
Fig. 4.
Loss of Fgfr1 leads to hyperproliferation and differentiation of Gli1+ progenitor cells. a–d, f–i Proliferating cells stained with Ki67 in Fgfr1fl/fl and Gli1-CreER;Fgfr1fl/fl mice at PN7.5 and PN14. The white arrow points to Ki67+ cells in the papilla and follicle. e, j Quantification of Ki67+ cells in control and Fgfr1 mutant mice at PN7.5 and PN14. e P = 0.007 3, j P = 0.001 5, n = 3, and each point represents one animal, with unpaired Student’s t-test performed. k–n Expression of Pthlh in control and Fgfr1 mutant mice at PN14. The white arrow points to cementoblasts expressing Pthlh along the tooth root surface. o Quantification of Pthlh+ cells in control and Fgfr1 mutant mice at PN14. P = 0.000 8, n = 3, and each point represents one animal, with unpaired Student’s t-test performed. p–s Expression of Ibsp and Sp7 in control and Fgfr1 mutant mice at PN14. The white arrowhead points to cementoblasts expressing Ibsp and Sp7 along the tooth root surface; the white arrow points to increased Ibsp and Sp7 in cementoblasts and periodontium. t, u Quantification of Ibsp+ and Sp7+ cells in control and Fgfr1 mutant mice at PN14. t P = 0.000 4, (u) P = 0.000 5, n = 3, and each point represents one animal, with unpaired Student’s t-test performed. The Schematic at the bottom indicates the induction protocol. **P < 0.01, ***P < 0.001, Scale bars, 100 μm

