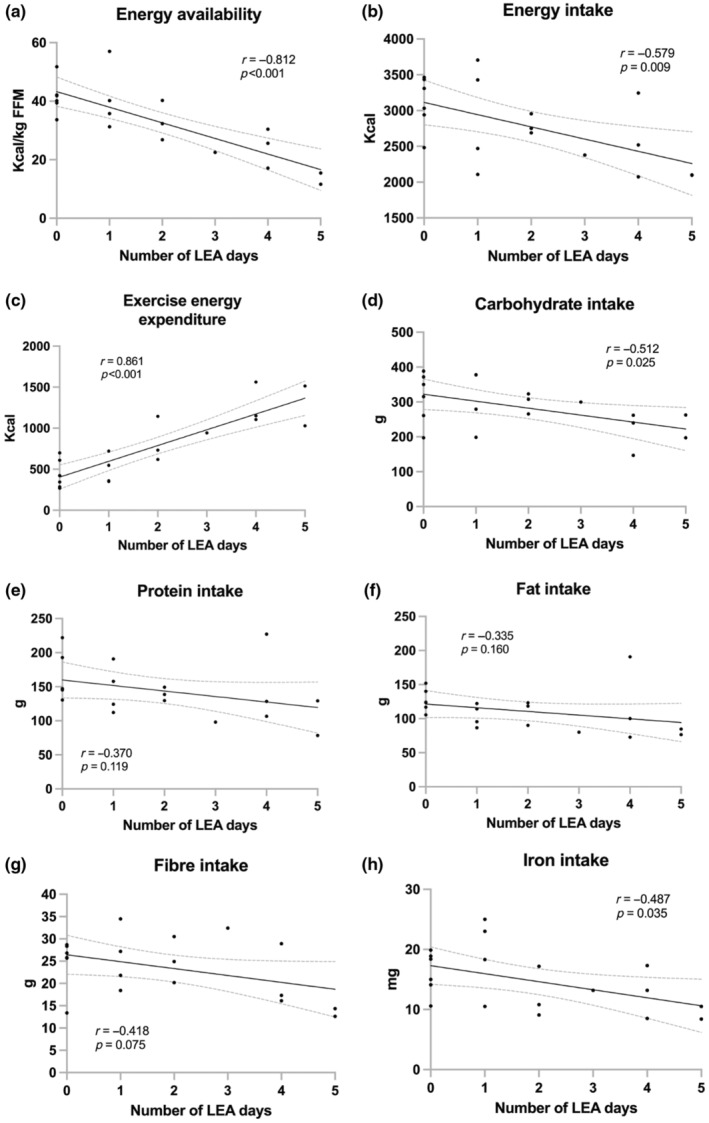
FIGURE 3.

Correlations between number of low energy availability (LEA; EA <25 kcal/kg fat free mass) days with average (a) energy availability, (b) energy intake, (c) exercise energy expenditure, (d) carbohydrate intake, (e) protein intake, (f) fat intake, (g) fiber intake, and (h) iron intake. Correlations presented as Pearson coefficients (r) with best‐fit lines and 95% confidence bands.
