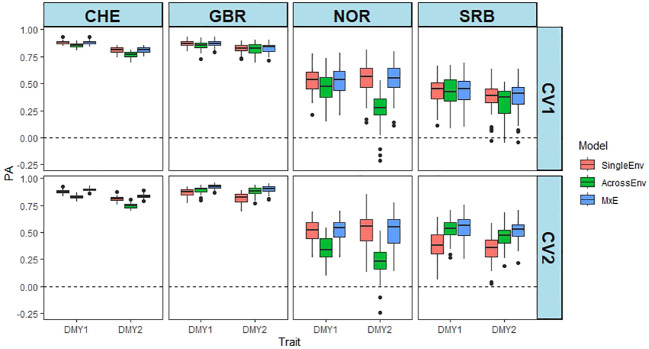
Figure 1.
Predictive ability (PA) of DMY in year 1 and 2 (e.g. CHE_DMY1, CHE_DMY2 etc.) at four locations. PA is the Pearson correlation between predicted and the scaled and normalised BLUE values of DMY using SingleEnv, AcrossEnv and MxE models and CV1 and CV2 cross validation methods. The environmental comparisons are between year 1 and year 2 at each location separately. The boxplots represent 50 training-test partitions.

