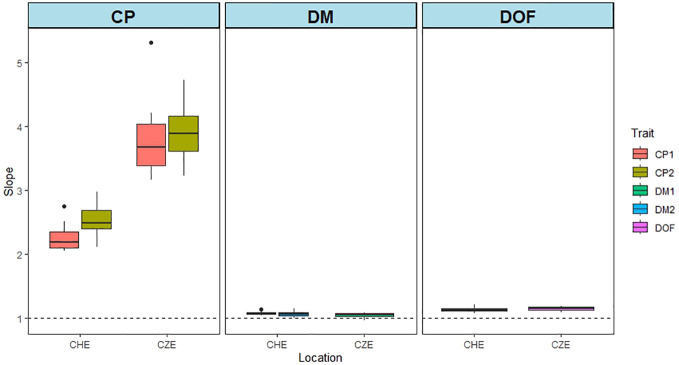
Figure 5.
Bias of predictions for data from CHE and CZE. The graphs show the slopes of the regression of GEBVs on phenotypic values. The stippled line indicates a slope value of 1. The GEBVs are based on the joint analysis of all the environments for each of the three traits: CP content, DMY and DOF. The MxE interaction model and the CV2 cross validation method were used. Fifty iterations of training-test set combinations were performed. CP1 and CP2 represents CP content of cut 1 and cut 2 in year 1, respectively. DMY1 and DMY2 represent annual DMY in year 1 and year 2, respectively.

