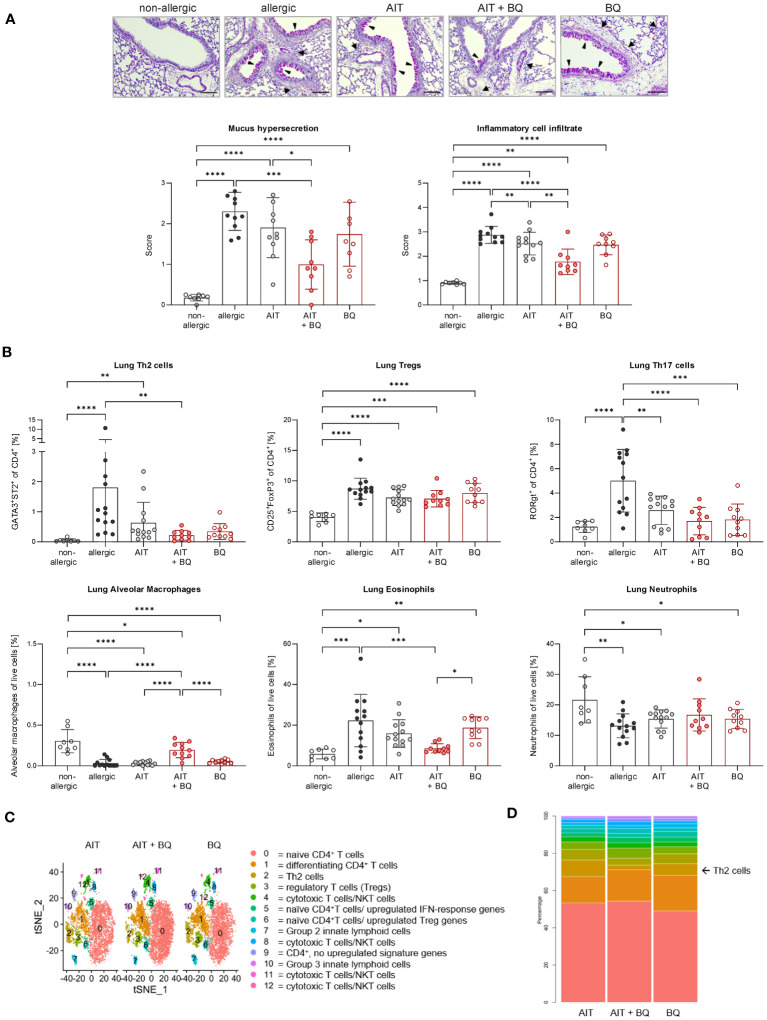
Figure 4.
Long-term effects of the combination of AIT and 10-Cl-BBQ treatment on lung histopathology and immune cells. (A) Representative PAS staining of lung sections (arrowheads: mucus hypersecretion; arrows: inflammatory cell infiltrate; scale bar: 100 µm) and scoring of mucus hypersecretion (n = 10 – 13) and inflammatory cell infiltrate (n = 10 – 13). (B) Flow cytometric analysis of Th cell subsets, alveolar macrophages, eosinophils, and neutrophils isolated from lung tissue (n = 10 – 13). Gaussian and non-Gaussian distributed results were analyzed by 1-way ANOVA with Tukey’s test or Kruskal-Wallis test with Dunn’s test, respectively. The bar charts show the mean with standard deviation. p-values of ≤.05, ≤.01, ≤.001, and ≤.0001 are shown as *, **, ***, and ****, respectively. (C) Clusters in tSNE embedding after scRNA-seq analysis of enriched pulmonary CD4+ T cells and (D) percentages of clusters. AIT, allergen-specific immunotherapy; BQ, 10-Cl-BBQ; CD, cluster of differentiation; NKT cells, natural killer T cells; PAS, periodic acid-Schiff; scRNA-seq, single-cell RNA sequencing; Th & Treg, T helper & regulatory cells; tSNE, t-distributed stochastic neighbor.

