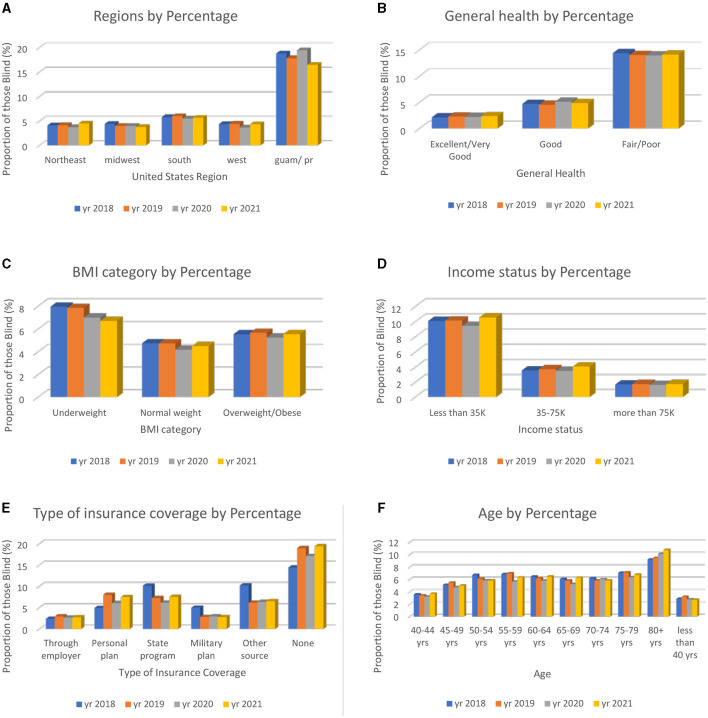
Figure 2.
Six explanatory variables chosen from the bivariate analysis to show the characteristics of those who answered “yes” to blindness or having serious difficulty seeing, even with glasses. The total percentages of the combined data (2018–2021) are presented. (A) Total percentage of those who are VI based on geographic location state. (B) Total percentage of those who are VI based on personal health rating. (C) Total percentage of those who are VI based on BMI categories. (D) Total percentage of those who are VI based on income status. (E) Total percentage of those who are VI based on insurance source type. (F) Total percentage of those who are VI based on age.

