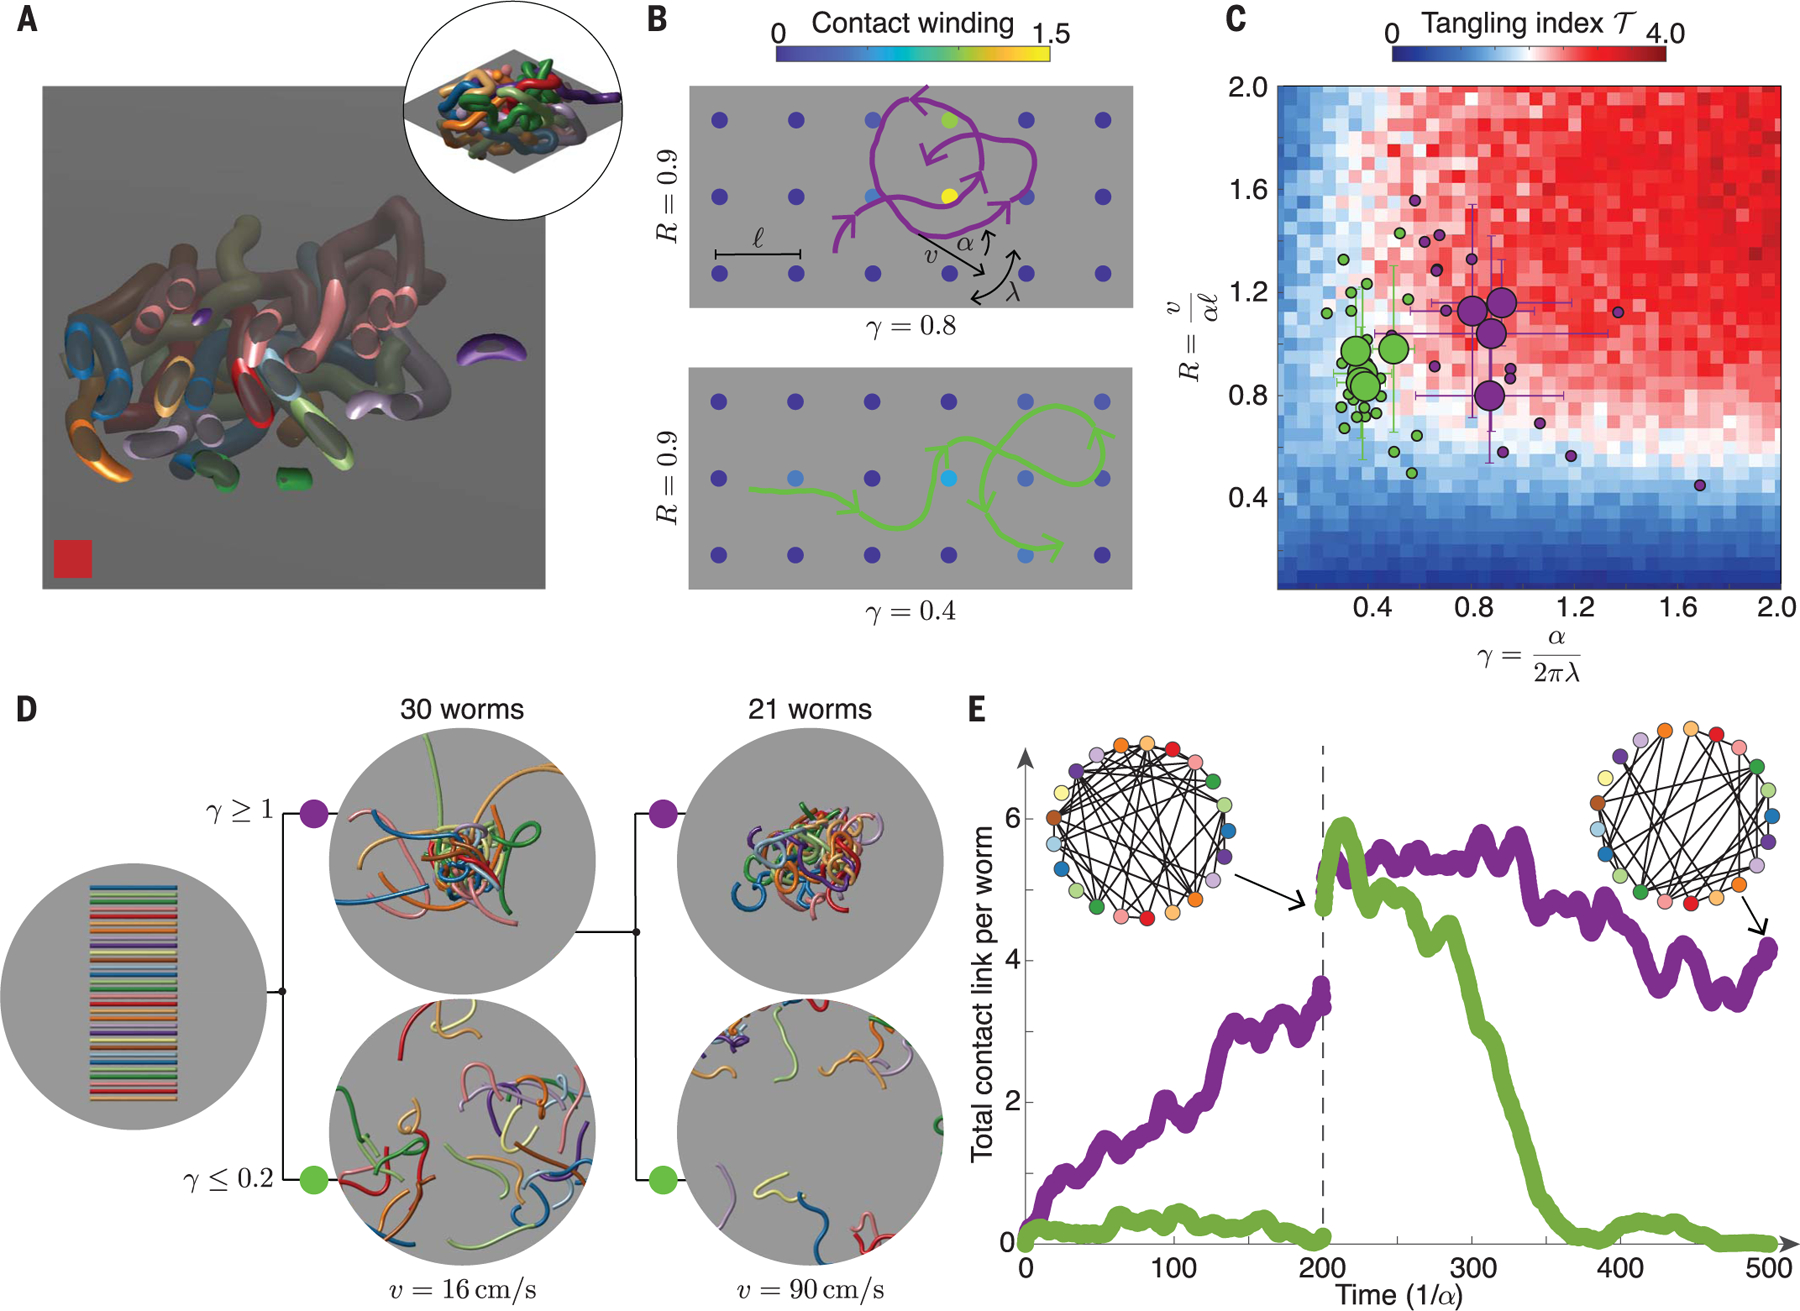
Fig. 4. Bioinspired tangling model reveals phase diagram underlying topological assembly and manipulation of generic tangles.

(A) Two-dimensional cross sections of 3D ultrasound reconstructions indicate the obstacle landscape faced by a worm exhibiting quasi-2D motion. (B) A 2D mean-field tangling model measures the winding of a worm-head trajectory (purple and green curves) around fixed obstacles in the plane (solid circles). Contact winding, , around obstacles that are far from the trajectory (23) is 0. Points with contribute to the tangling index, , of a trajectory (Eq. 3). Trajectories with small chirality number, , have smaller overall contact winding. (C) Measured values of and for blackworms undergoing tangling (purple disks) or untangling (green disks) dynamics lie in regions of the tangle phase space corresponding to tangling (red, ) and untangling (blue, ), where the critical value corresponds to a connected tangle graph, and hence a minimally tangled state. The untangling data consists of worms (small green disks) from separate 12-worm untangling experiments, and the tangling data consists of worms (small purple disks) from separate 5-worm tangling experiments. The large disks show mean values of and obtained by averaging over all worms in a given experiment (23). Error bars show standard deviation. (D) Worm gaits predicted by the tangling phase diagram enable robust control of topological transitions (movie S4). Tangle formation and avoidance can be controlled at fixed by varying , both for low worm speeds , (middle, ) and high worm speeds (right, ). Worms have a length of 40 mm and a radius of 0.5 mm. Displayed worms are thickened to aid visualization. (E) Timescales of tangling and untangling from simulations in (D) are set by , which varies from the low simulations (, ) to the high simulations (, ). The largest cluster of touching worms produced by the low , large simulation is used as the initial condition for the high simulations (23), causing an apparent jump in total contact link per worm at . Tangle graphs (insets) illustrate the topological structure of the simulated tangles.
