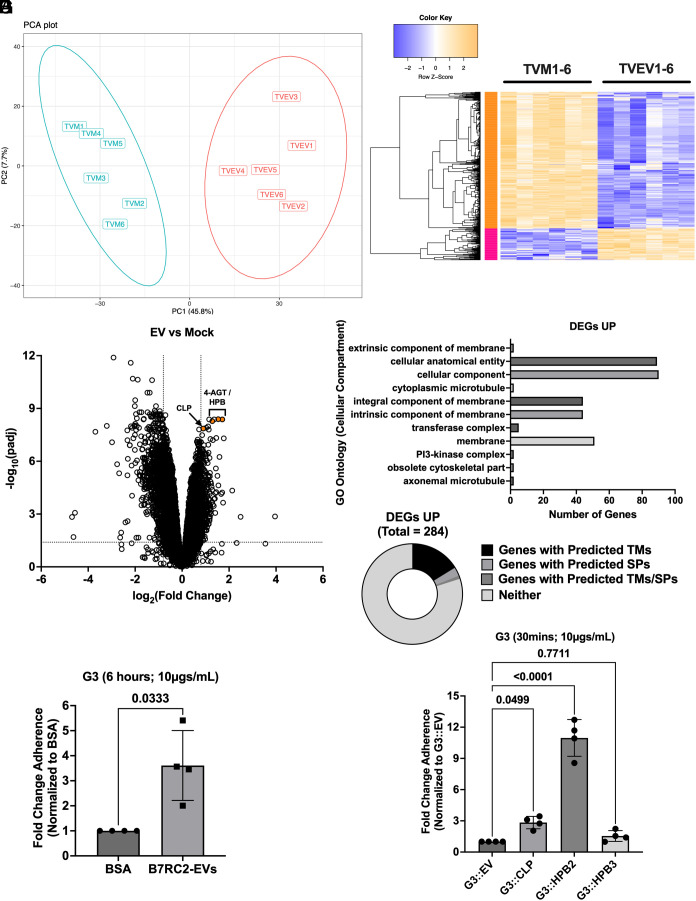
Fig. 5.
B7RC2-EVs up-regulate expression of parasite proteins involved in host cell adherence. (A) Principal components analysis showing distinct clustering of mock treated parasites (TVM; n = 6) and B7RC2-EV treated parasites (TVEV; n = 6) from RNA-seq data generated in this study. (B) Heatmap of 1,086 genes [281 up-regulated and 805 down-regulated; Log2(FC) > 0.8 or Log2(FC) < −0.8; padj < 0.05] identified as differentially expressed between the mock and B7RC2-EV treated parasites. (C) Volcano plot depicting differences in gene expression between B7RC2-EVs and mock treated parasites. The x axis corresponds to the log2 fold change in gene expression and the y axis indicates the adjusted P value. Genes with a −log10 P value of 1.3 or greater (P value of ≤ 0.05) and a log2 fold change −0.8 ≤ or ≥ 0.8 were deemed significantly differentially expressed. (D) GO enrichment analysis 281 up-regulated DEGs for predicted cellular compartment enrichment. (E) Pie chart of percentage of 281 up-regulated DEGs with predicted transmembrane domain or signal peptides as annotated in TrichDB (www.trichdb.org). (F) Quantification of parasite adherence to BPH-1. Data are depicted as fold change in adherence compared to BSA control. Bars, mean ± SD. N = 6 wells/experiment, four experiments total. Numbers above bars indicate P-values for Welch’s t test compared to BSA control. (G) Quantification of parasite adherence to BPH-1. Data are depicted as fold change in adherence compared to empty vector (G3::EV) control. Bars, mean ± SD. N = 6 wells/experiment, four experiments total. Numbers above bars indicate P-values for one-way ANOVA, Dunnett’s multiple comparisons test compared to G3::EV control.

