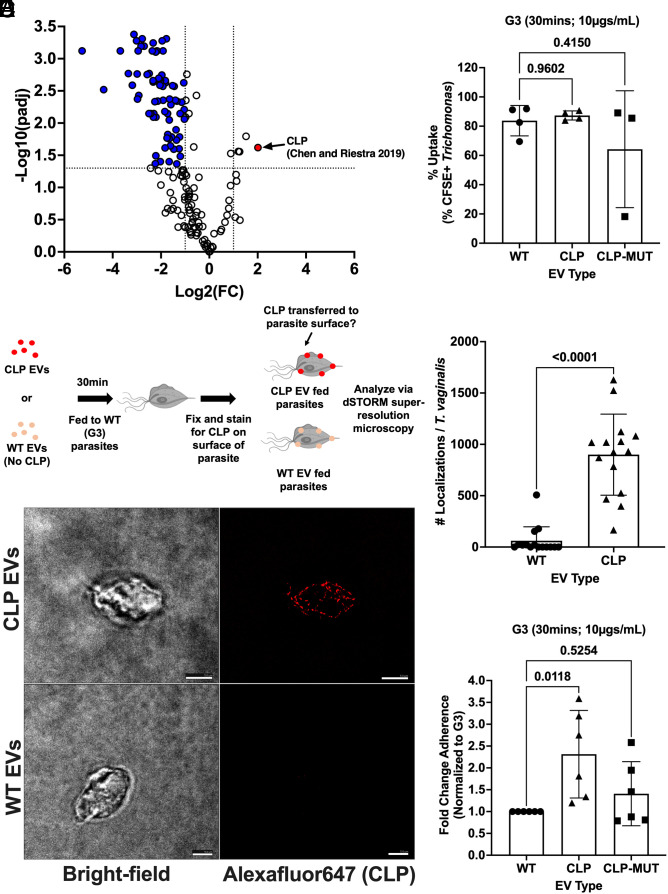
Fig. 6.
CLP can be transferred between T. vaginalis parasites via TvEVs resulting in increased parasite adherence to host cells. (A) Volcano plot depicting differences in protein abundance between B7RC2-EVs and NYH209-EVs. The x axis corresponds to the log2 fold change in protein abundance and the y axis indicates the adjusted P value. Proteins with a −log10 P value of 1.3 or greater (P value of ≤ 0.05) and a log2 fold change −1 ≤ or ≥ 1 were deemed differentially abundant. (B) Percent uptake of CFSE-labeled TvEVs from indicated strains by T. vaginalis strain G3. Percent uptake was measured by the percent of CFSE-positive parasites in the entire population. Bars, mean ± SD. N = 3 replicates/experiment, 3 to 4 experiments total. (C) Top, graphical depiction of CLP-EV transfer experiment and subsequent dSTORM imaging. Created with BioRender.com. Bottom, representative IFA for GFP-tagged CLP of parasites fed either WT-EVs or CLP-EVs using dSTORM. (Scale bar, 5 µm.) (D) Quantification of the number of localizations for WT-EV and CLP-EV treated parasites. Bars, mean ± SD. N = 5 parasites/experiment, 15 parasites total were imaged and quantified. (E) Quantification of parasite adherence to BPH-1. Data are depicted as fold change in adherence compared to G3 control. Bars, mean ± SD. N = 6 wells/experiment, five experiments total. (B and E) Numbers above bars indicate P-values for one-way ANOVA, Dunnett’s multiple comparisons test compared to WT control. ns = not significant. (D) Numbers above bars indicate P-values for the Mann–Whitney test compared to WT control.

