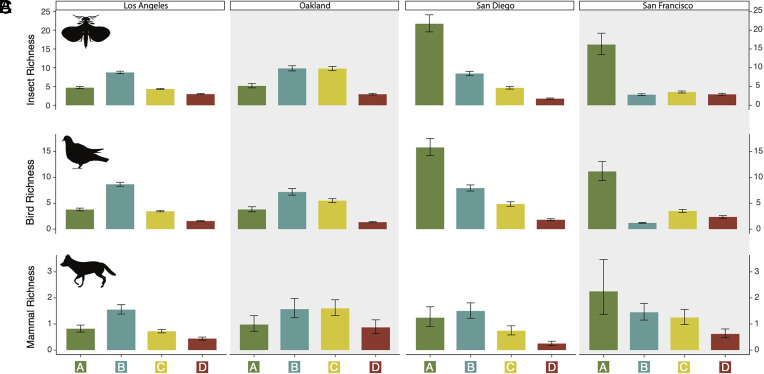
Fig. 3.
Clade richness is consistently lower in redlined neighborhoods. Species richness for (A) insects (top row), (B) birds (middle row), and (C) mammals (bottom row) shown among HOLC grades for each Californian city (columns). Los Angeles is on the far left, Oakland is on the middle left, San Diego is on the middle right, and San Francisco is on the far right. Bars represent the mean, and whiskers represent 95% credible intervals. All pairwise comparisons are significant. All comparisons between green- (i.e., grade A) and redlined (i.e., grade D) neighborhoods are significant. Note: for each clade, the y-axis (species richness) is subject to change.

