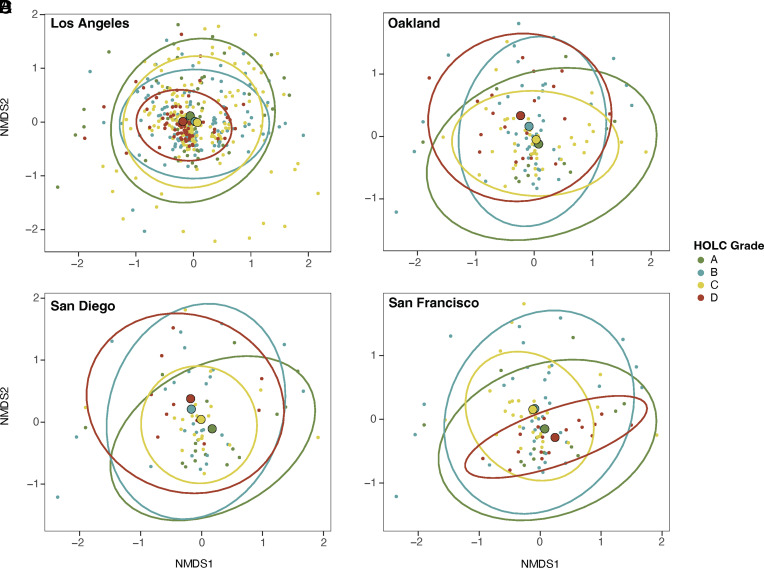
Fig. 4.
Redlined neighborhoods differ in their species assemblage. Nonmetric multidimensional scaling (NMDS) for β-diversity (Jaccard’s metric) among HOLC grades in (A) Los Angeles, (B) Oakland, (C) San Diego, and (D) San Francisco. Each dot represents a neighborhood and ellipses encompass 95% data points. No overlap between ellipses suggests that HOLC grades have distinct beta diversity patterns and strong dissimilarity in species assemblage. Substantial overlap in ellipses suggests that beta diversity between HOLC grades is more similar to each other and there is strong similarity in species assemblage.

