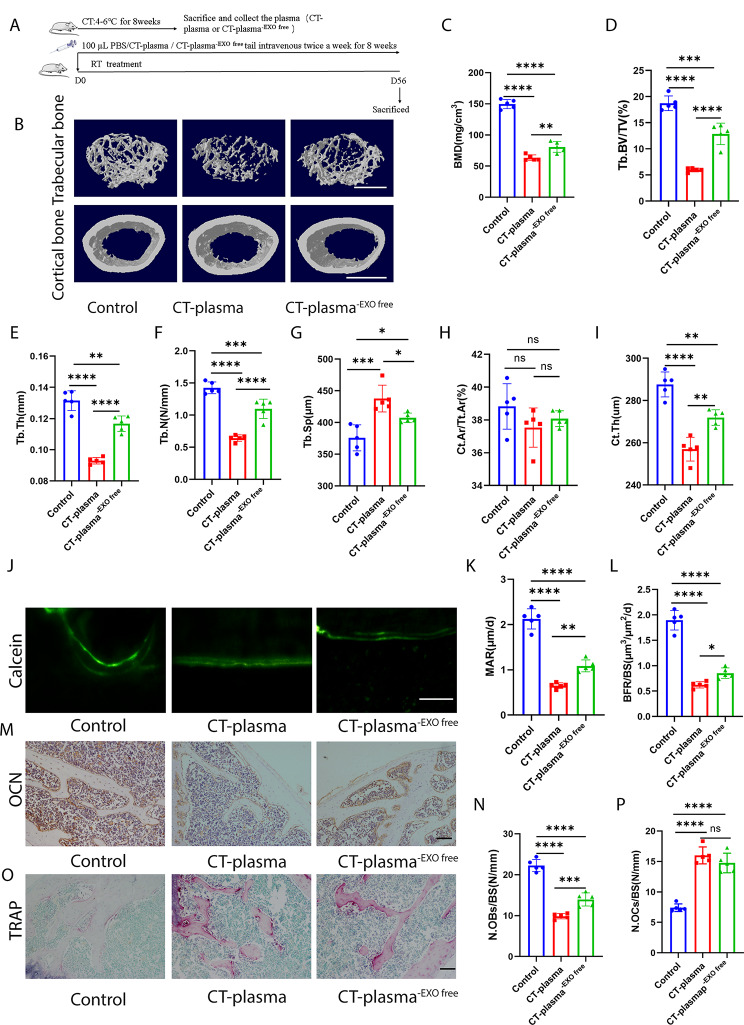
Fig. 3.
CT-induced plasma can decrease bone mass, removal of exosomes can ameliorate CT-induced plasma-triggered osteopenia. A, Schematic flow diagram representing mice treated with PBS, CT-plasma, or CT-plasma-EXO. n = 5 per group. B, Representative micro-CT images of trabecular (top) and cortical (bottom) bone in CT-plasma- or CT-plasma-EXO-treated mice. Scale bars represent 500 μm (top) and 1 mm (bottom). C–I, Parameters of trabecular bone mass analysed by micro-CT: BMD, Tb. BV/TV, Tb. Th, Tb. N, Tb. Sp, Ct. Ar/Tt. Ar, Ct. Th. n = 5 per group. J, Calcein double labelling images of the mineralized surface of mouse femora. Scale bar represents 50 μm. K, L, Parameters of bone formation. MAR, mineral apposition rate; BFR/BS, bone formation rate/bone surface. n = 5 per group. M, Representative OCN-stained section. Scale bar represents 100 μm. N, Quantification of the number of osteoblasts (N. OBs) on the trabecular bone surface (BS) in distal femora. n = 5 per group. O, TRAP-stained sections. Scale bar represents 100 μm. P, quantification of the number of osteoclasts (N. OCs) on the trabecular bone surface (BS) in distal femora. n = 5 per group. The control group were injected PBS. * P < 0.05, ** P < 0.01, *** P < 0.001, **** P < 0.0001

