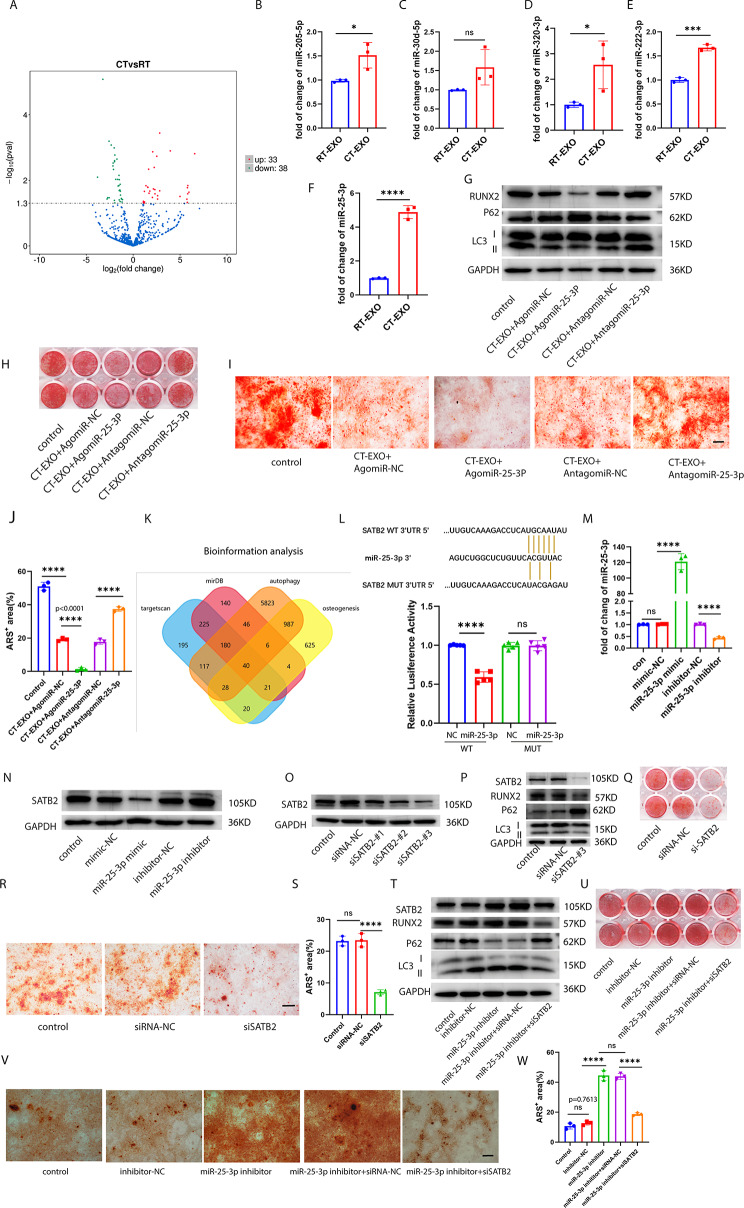
Fig. 7.
Exosomal miR-25-3p enriched in CT-EXO regulated osteogenic differentiation and autophagy by tageting SATB2 in BMSCs. A, Volcano diagram of differential expression between between RT-EXO and CT-EXO miRNA according to microarray analysis. B–F, qRT-PCR quantitative results of miRNA (miR-205-5p, miR-30d-5p, miR-320-3p, miR-222-3p, miR-25-3p) level of RT-EXO or CT-EXO. n = 3 per group. G, Representative western blot image showing the expression protein levels of RUNX2, P62, and LC3 from miR-25-3p knocked-in or miR-25-3p knocked-down CT-EXO-treated BMSCs. H, I, Representative image of microscopic view (H) and entire plate view (I) ARS staining from miR-25-3p knocked-in or miR-25-3p knocked-down CT-EXO-treated BMSCs. Scale bar represents 250 μm J, Quantification of ARS. n = 3 per group. K, Venn diagram of the predicted target gene of miR-25-3p from Target scan (blue), miRDB (red), autophagy(yellow), and osteogenesis (orange). L, Luciferase reporter assays were conducted using luciferase constructs carrying a WT or mutant SATB2 3′-UTR co-transfected into BMSCs with miR-25-3p mimics. Firefly luciferase activity was normalized to Renilla luciferase activity. n = 5 per group. M, Transfection efficiency of miR-25-3p detected by qRT-PCR. N, Representative western blot image showing the protein expression levels of SATB2 from miR-25-3p knocked-in miR-25-3p knocked-down BMSCs. O, Knockout efficiency of SATB2 in BMSCs by western blot. P, SATB2, RUNX2, P62, and LC3 expression were measured in the BMSCs treated with siSATB2#3 or siRNA control. Q, R, Representative image of microscopic view (Q) and entire plate view (R)ARS staining. Scale bar represents 250 μm. S, Quantification of ARS. T, Representative western blot image showing the expression protein levels of SATB2, RUNX2, P62, and LC3 from the inhibitor-NC, inhibitor, inhibitor + siRNA-NC, inhibitor + siSATB2 groups. U, V, Representative image of microscopic view (U) and entire plate view (V)ARS staining. Scale bar represents 250 μm. W, Quantification of ARS. n = 3 per group. All groups’ cells have received osteogenic induction, the control group represents the group undergoing osteogenic induction without any intervention. CT-EXO + AgomiR-NC and CT-EXO-AntagomiR-NC served as negative controls for CT-EXO + AgomiR-25-3p and CT-EXO-AntagomiR-25-3p. * P < 0.05, ** P < 0.01, *** P < 0.001, **** P < 0.0001

