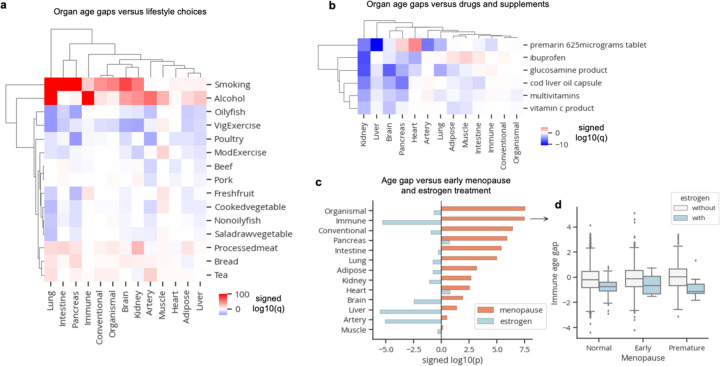
Figure 3. Organ age estimates are sensitive to modifiable lifestyle choices.
a, Linear regression was used to determine the association between age gaps and modifiable lifestyle choices while accounting for age and sex. Heatmap colored by signed log10(q-value) is shown. Only significant (q<0.05) values are colored.
b, Linear regression was used to determine the association between age gaps and drugs/supplement intake while accounting for age and sex. Only drugs with significant (q<0.05) youthful associations in at least two organs are shown. Heatmap is colored by signed log10(q-value). Only significant (q<0.05) values are colored.
c, Linear regression was used to determine the association between age gaps versus early menopause and estrogen treatment together. Bar plot showing signed log10(p-value) for menopause and estrogen covariates is shown.
d, Boxplot visualization of immune age gaps in individuals stratified by menopause status and estrogen treatment. Standard boxplot structure was used.

