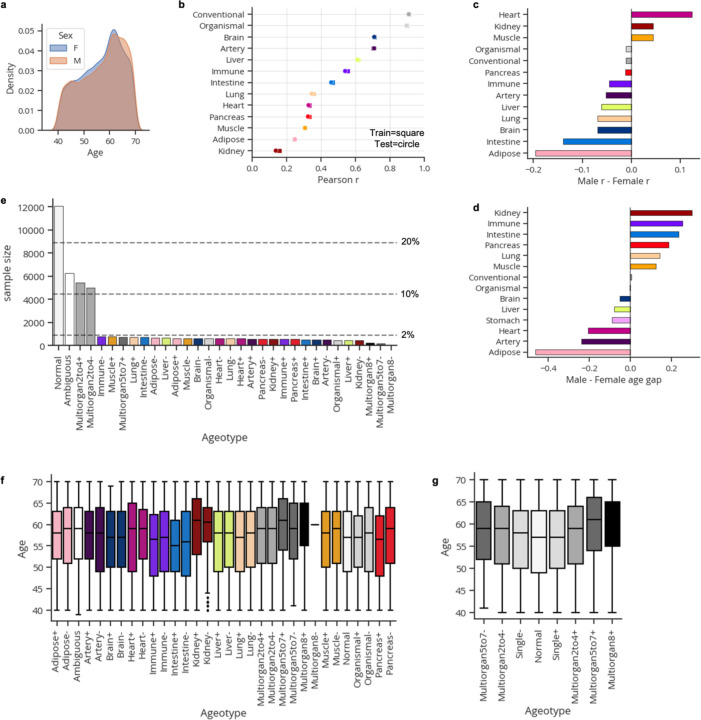
Extended Data Figure 1. Organ aging models in the UK Biobank.
a, Age-at-blood-draw distribution by biological sex.
b, Correlation between predicted and actual age across all aging models and train/test splits.
c, Difference in correlation between predicted and actual age by biological sex.
d, Mean difference in organ age gaps between males and females.
e, Extreme ager ageotype sample sizes and proportions.
f, Age distributions per extreme ager ageotype
g, Age distributions per aggregated extreme ager ageotype. Individuals with many aged or youthful organs are significantly older than normal and single organ agers.

