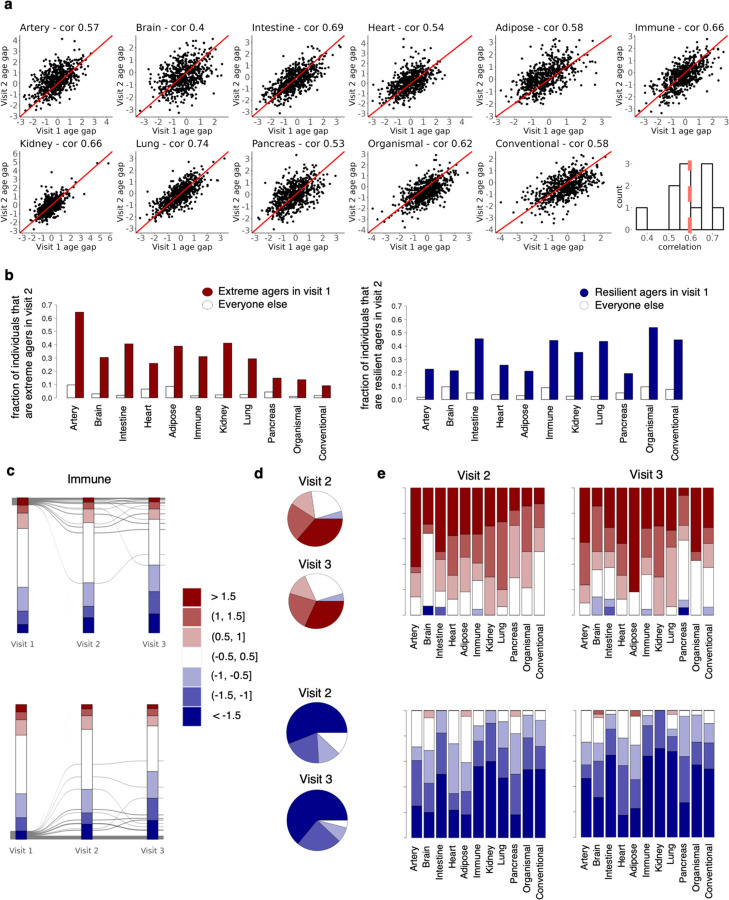
Extended Data Figure 2. Age gaps are stable across longitudinal visits.
a, Longitudinal proteomics data from a subset of 937 individuals were analyzed. Longitudinal data were available only on the 1k-protein platform, so new aging models trained on the 1k-platform were developed. New aging models were trained on 44,406 samples without longitudinal data and tested on samples with longitudinal data (937 unique individuals). Only 1k-aging models with age estimates that were correlated r2>=0.8 with 3k-based age estimates were included for downstream analyses. Correlation between visit 1 (baseline, 2006–2010) and visit 2 (imaging visit 1, 2014+) age gaps are shown.
b, Bar plot showing fractions of visit 1 extreme agers and non-visit 1 extreme agers that are extreme agers in the same organ in visit 2. Equivalent plot for youthful agers is shown on the right.
c, Age gaps were grouped into bins of 0.5 standard deviation to determine changes in age gap bins across visits. Individual trajectories across visits for extreme immune agers are shown. Equivalent plot for youthful immune agers is shown at the bottom.
d, Pie chart showing percent distribution of immune age gap bins in visit 2 (2014+) and visit 3 (2019+) for individuals who are extreme immune agers in visit 1. Equivalent plot for youthful immune agers is shown at the bottom.
e, Stacked bar plot showing percent distribution of age gap bins in visit 2 and visit 3 for individuals who are extreme agers in visit 1. Equivalent plot for youthful agers is shown at the bottom.

