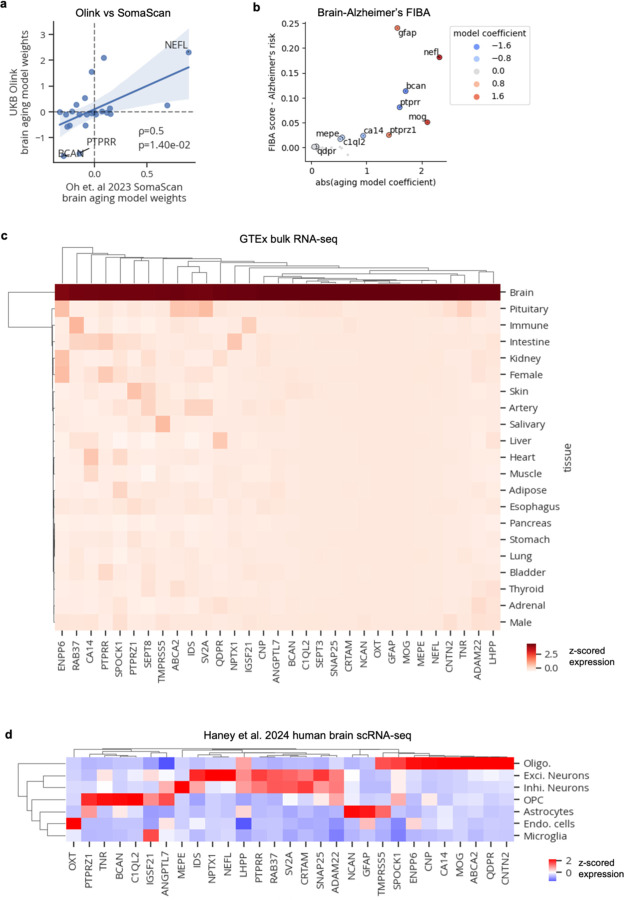
Extended Data Figure 5. Brain aging proteins.
a, Scatterplot showing model weights from this study’s Olink-based aging model (y-axis) and Oh et. al 2023’s SomaScan-based brain aging model (x-axis). Spearman correlation and p-value shown.
b, Scatterplot showing results from feature importance for biological aging (FIBA) algorithm to identify proteins in the brain aging model contributing to the brain age gap’s association with Alzheimer’s disease risk. FIBA score (y-axis) indicates Alzheimer’s disease risk effect size loss after permutation of protein values. X-axis indicates absolute protein weight in the brain aging model. Color indicates protein weight in the brain aging model.
c, Mean gene expression of brain aging protein-encoding genes in GTEx tissue bulk RNA-seq data.
d, Mean gene expression of brain aging protein-encoding genes in Haney et al. 2024 human brain scRNA-seq data.

