
Figure 4: Secondary validation of target specificity, with scRNA-seq and whole-brain imaging.
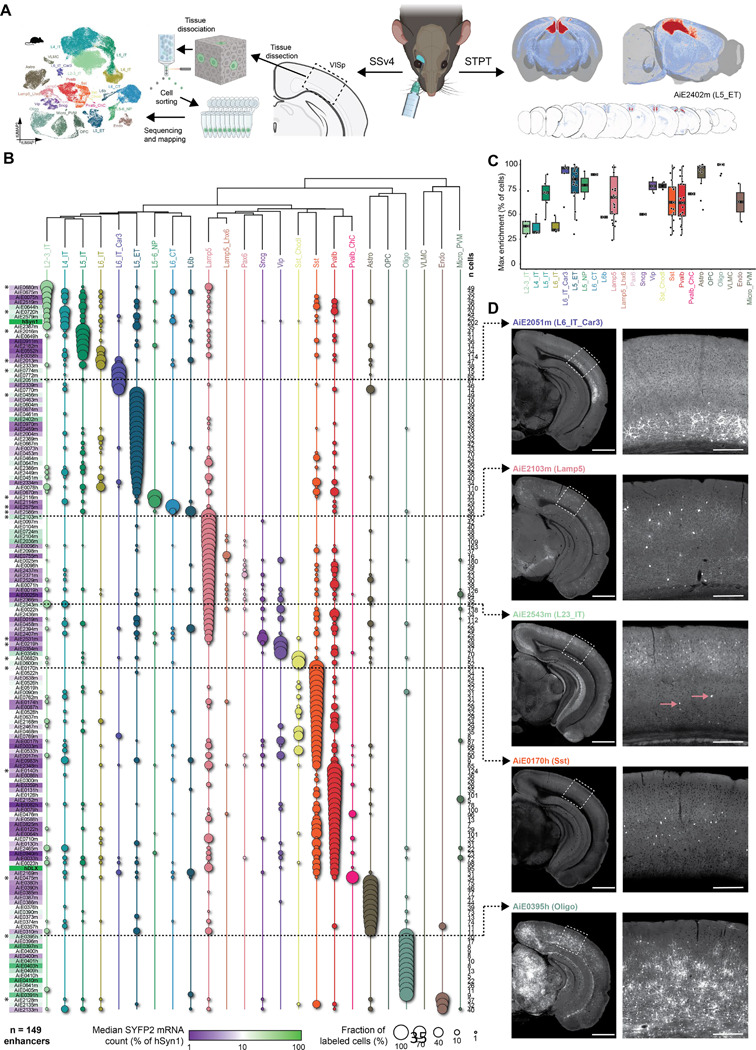
A. Schematic of methods for secondary validation. B. scRNA-seq analysis using SSv4, of FACS-sorted SYFP2+ cells from the mouse visual cortex, following RO administration of the enhancer AAV. The fraction of cells mapped to each cortical subclass corresponds to circle size, and the median SYFP2 mRNA count in each experiment, relative to the hSyn1 promoter, is denoted by a purple-to-green color gradient. The number of sequenced cells for each experiment is shown to the right of the table. Total number of enhancers examined is n = 149. Asterisks denote the top performing enhancers for each subclass, i.e., the ones with highest proportion of cells mapping to the subclass of interest. C. Box plot showing for each cortical population, all enhancer AAVs for which that population was the main enriched target population. The thick black bars represent medians, color-coded boxes represent top and bottom 25%, and whiskers represent top and bottom 10%. Data for individual enhancers is shown as superimposed black circles. D. Representative STPT images for five enhancers, with an expanded view of VISp displayed to the right. Dashed arrows connect each image set to its corresponding SSv4 data. In the case of AiE2543m, which labels L2–3_IT cells and Lamp5 cells, pink arrows point to sparse, yet brightly labeled non-L2–3 neurons, which are likely the Lamp5 interneurons. These are overrepresented in SSv4 (B), likely due to the stringent gating strategy in FACS focusing on the highly fluorescent cells. For images, scale bars for the hemisphere and the VISp magnified view are 1.0 and 0.2 mm, respectively.