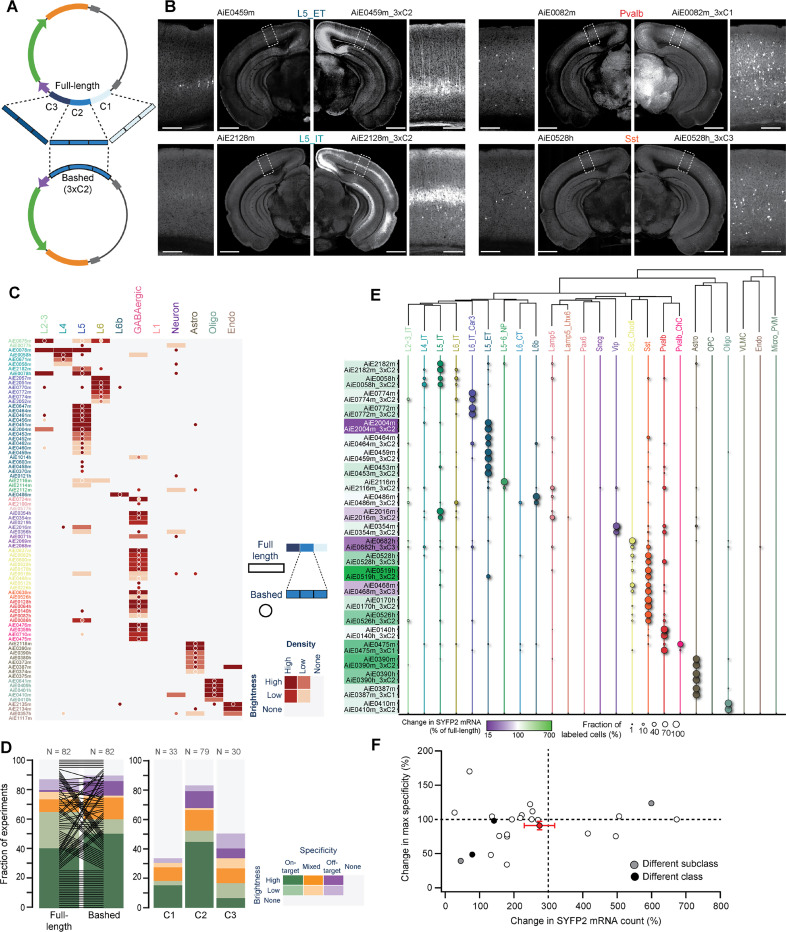
Figure 5: Optimization of enhancer activity through core bashing.
A. Schematic representation of the core bashing approach for enhancer optimization (C = Core). B. Representative STPT images of coronal hemisections, showing labeling pattern for four individual full-length enhancers (left) and their best bashed version (right), which was selected according to the combination of brightness and specificity. A magnified view of VISp is shown alongside each hemisection. Scale bars for full section and expanded view are 1.0 and 0.2 mm, respectively. C. Heatmap showing the scoring results of epifluorescence image sets of the full-length enhancer (rectangles) alongside its best bashed version (circles); n = 82 pairs. D. Summary of the scoring data in (C), sorted according to brightness and specificity of the full-length vs. the bashed enhancer (left) and for the different cores tested (right). E. Dot plot of SSv4 data for full-length enhancers and their bashed counterpart shown in pairs, with circle size denoting the fraction of cells mapped to each of the cortical subclasses in each experiment. The color overlaying each pair name corresponds to the relative change in SYFP2 transcript count of the bashed relative to the full-length enhancer; n = 24 pairs. F. Change in specificity vs. change in SYFP2 transcript count for all enhancer pairs in (E). Average and SEM for all experiments corresponds to the red dot with error bars. Pairwise comparisons for individual enhancers correspond to white dots if no change in specificity if observed. If the bashed version preferentially labeled a different subclass or class compared to the corresponding full-length enhancer, the dots are grey or black, respectively.

