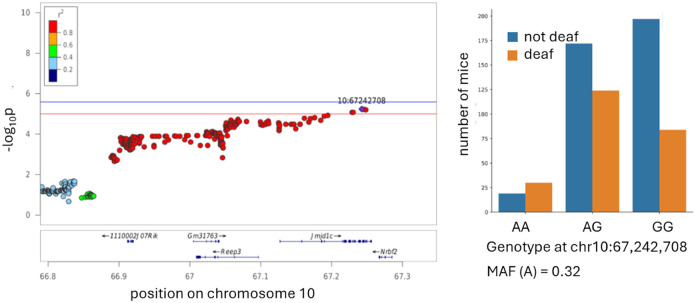
Figure 6. QTL for the trait of being deaf at 10 month.
The regional association plots are shown on the left. The x-axis shows the position on a chromosome (in Mb); the y-axis shows the significance of the association (−log10 p-value). The individual points represent SNPs. The SNP with the lowest p-value (“top SNP”) is highlighted in purple. The colors represent the correlation between the topSNP and the other SNP. The red line indicated a threshold for genome-wide alpha of < 0.10 (−log10(p) > 5.0); the blue line indicated a threshold for genome-wide alpha of < 0.05 (−log10(p) > 5.58). The effect plots for the top SNP are shown on the right, minor allele frequency (MAF) indicated.

