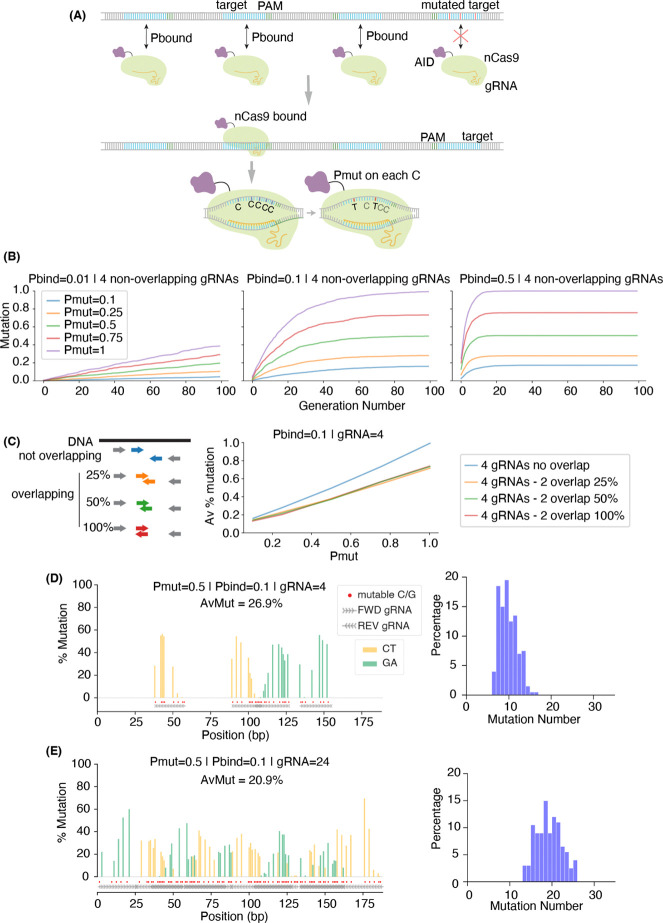
Figure 4. Simulating the expected number and distribution of mutations.
(A) Simple model of mutations caused by AID-nCas9 in two probabilistic steps. First, each gRNA guides the binding of nCas9 to an intact target site with probability pbound. Upon binding, AID mutates each of available C with a probability pmut. Upon successful mutagenesis, the pbound of any gRNA overlapping the mutated sequence becomes zero. (B) Accumulated average fraction of mutations over time for different values of pbound and pmut for four non-overlapping gRNAs. Simulations of mutations accumulated in 200 cells over 100 generations. (C) Average fraction of mutations at the end of the simulation (generation 100) when different amounts of gRNA overlap were considered, for a range of pbound (different colors) and pmut (x-axis). (D-E) Expected mutation profile (left) and distribution of mutations per read (right) when targeting GFP with (D) 4 gRNAs or (E) 24 gRNAs, pbound = 0.1 and pmut = 0.5. Average of 200 mutations simulated in 200 cells. Red dots mark all “mutable bases” (Cs on FWD gRNAs and Gs on REV gRNAs). Insets show the distribution of the number of C→T or G→A mismatches per read on these mutable bases, after subtracting the number of mismatches observed in control samples.

