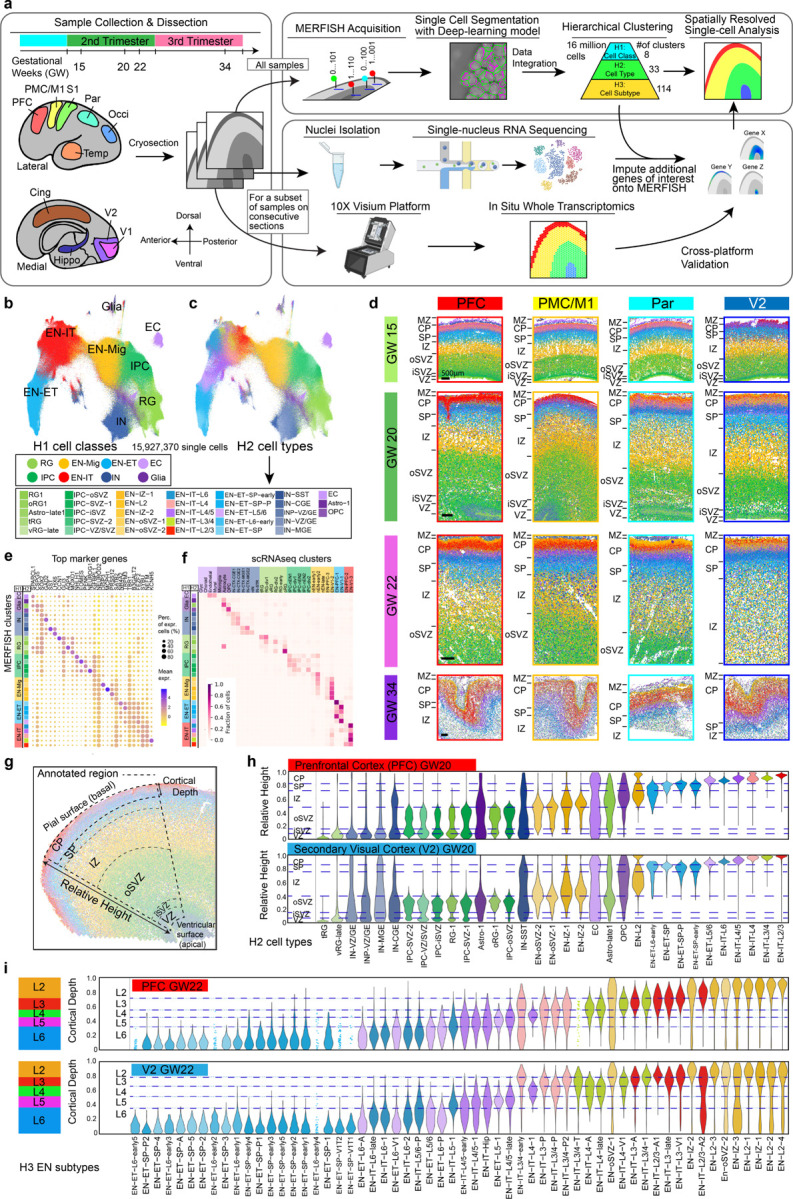
Fig. 1: A spatially resolved single-cell atlas of human fetal cortical development.

a, Schematics of sampling and workflow. PFC; prefrontal cortex; PMC, premotor cortex; M1, primary motor cortex; S1, primary somatosensory cortex; Par, parietal cortex; Occi, occipital cortex; Temp, temporal cortex; Cing, cingulate cortex; Hippo, hippocampus; V1, primary visual cortex; V2, secondary visual cortex. b, c, Uniform Manifold Approximation and Projection (UMAP) of single cells analyzed by MERFISH, colored by H1 cell classes (b), and by H2 cell types (c). RG, radial glia; IPC, intermediate progenitor cells; EN-Mig, migrating excitatory neurons; EN-IT, intratelencephalic excitatory neurons; EN-ET, extratelencephalic excitatory neurons; IN, inhibitory neurons; EC, endothelial cells; oRG, outer radial glia; tRC, truncated radial glia; vRG, ventricular radial glia; INP, inhibitory neuron progenitors; CGE, caudal ganglionic eminence; MGE, medial ganglionic eminence; OPC, oligodendrocyte precursor cells. d, Spatial maps of H2 cell types from major cortical areas across gestational week (GW) 15 to 34. MZ, marginal zone; CP, cortical plate; SP, subplate; IZ, intermediate zone; oSVZ, outer subventricular zone; iSVZ, inner subventricular zone; VZ, ventricular zone. Scale bars, 500 µm. e, Dot plot showing expression of marker genes for H2 cell types. f, Cell type correspondence heatmap shows the fraction of cells from MERFISH H2 clusters that associate to clusters from published mid-gestation scRNA-seq dataset7. g, Schematics illustrating the annotated fan-shaped cortical area used for relative height (RH) and cortical depth (CD) calculation. h, Violin plots showing the laminar distribution of H2 cell types from the apical to basal surface quantified by the RH. The width of the violin for each cell type is normalized to the maximum value. i, Violin plots showing CD distribution of H3 EN subtypes within the CP. Dash lines represent the borders between cortical layers (L2-L6) calculated based on the CD distribution of layer-defining clusters. Clusters with fewer than 50 cells within the annotated region are represented by dots for individual cells instead of a violin.
