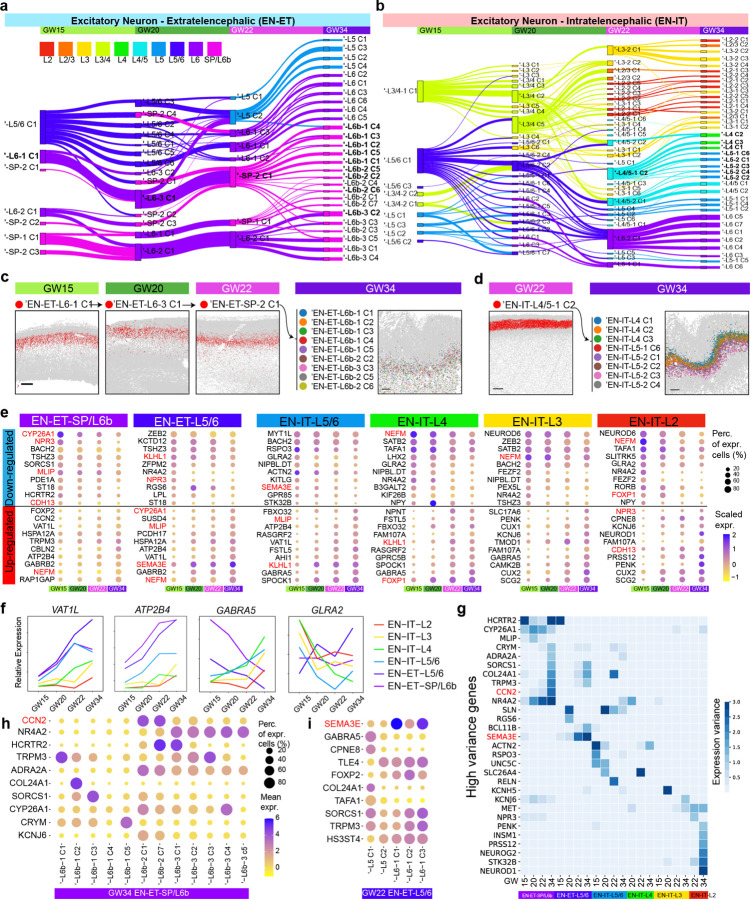
Fig. 4: Diversification of EN subtypes over time show continued post-mitotic fate specification.
a, b, Sankey diagram showing the correspondence between EN-ET (a) and EN-IT (b) subclusters from different gestational time points. Clustering was performed separately for each gestational age and the number of subclusters was determined single cell significant hierarchical clustering (scSHC).42 Nodes represent EN subtypes from this alternative clustering strategy. To differentiate these clusters from those identified through integrated analysis, an apostrophe (‘) prefixes the names of scSHC clusters. Thickness of edges represents the fraction of cells showing with correspondence, and edges with <0.1 fraction were hidden. Nodes and edges are colored based on the most enriched layer identity of the EN subtype. c, Spatial graphs for an inferred lineage (bolded in a) of Layer 6/SP EN-ETs across GW15 to GW34 show a conserved stream from GW15 to 22 before dramatic diversification at GW34. Scale bars, 500 µm. d, Spatial graphs showing a GW22 cluster EN-ITs spamming both Layers 4 and 5 specifying into seven GW34 clusters with refined layer specificity in either Layer 4 or 5 (bolded in b). Scale bars, 500 µm. e, Dot plots showing the top genes that are down- or up-regulated with gestational age among EN subtypes from each layer-based group. The genes that are downregulated over time in some categories but upregulated in others are highlighted in red. f, Curve plots show the change of relative expression over time in different groups for selected genes. g, Heatmap showing the genes with high expression variance among EN subtypes within the same group and gestational age. h, i, Dot plots showing the expression of high variance genes among EN subtypes in EN-ET-SP/L6b group at GW34 and EN-ET-L5/6 group at GW22.

