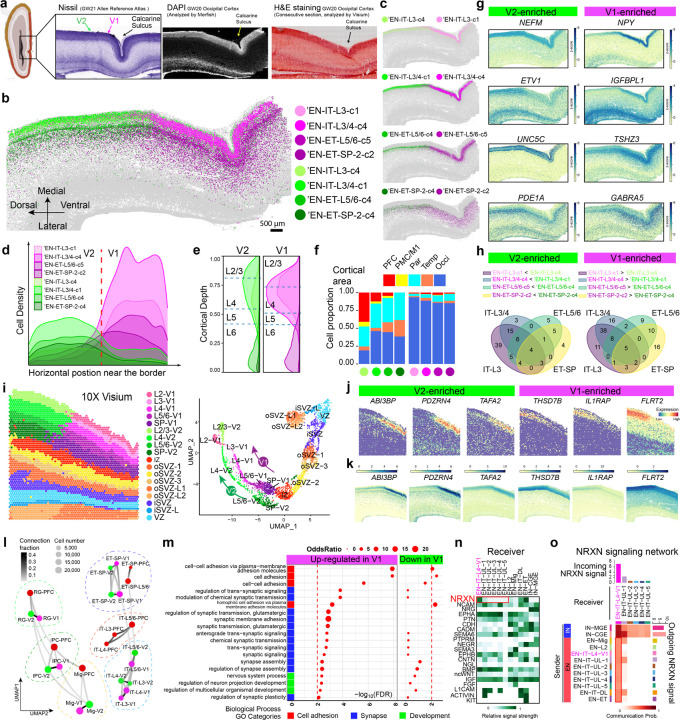
Fig. 5: Sharp molecular border between V1 and V2 at GW20 reveals early V1 specification.
a, The primary (V1) and secondary visual cortices (V2) do not exhibit morphological differences at GW20-21. Schematics and Nissl staining are taken from the Allen Reference Atlas for GW21 human fetal brain48. DAPI staining image co-captured with MERFISH; H&E staining image co-captured with Visium. b, c Spatial maps for selected EN subtypes show distinct border between V1 and V2 marked by sharp transition at GW20. Scale bars 500 µm. d, Ridgeline plots showing the horizontal cell density profile for V1- and V2-enriched EN subtypes in the CP near the border. e, Ridgeline plots showing the laminar distribution for V1- and V2-enriched EN subtypes. Dash lines represent the borders between cortical layers. f, Histograms for areal distribution show V2-enriched subtypes distribute broadly in other cortical areas, while V1-enriched subtypes are exclusive to the occipital cortex. g, Z-score spatial maps of V1- and V2-enriched genes. h, Venn diagrams for the overlap between V2-enriched (left) and V1-(right) DEGs across the four pairs of subtypes in c. Only strong DEGs with Log fold change >0.5 and adjusted p-value <0.0001 were considered. See Supplementary Table 7. i, Spatial graph (left) and UMAP (right) from Visium analysis show clear V1-V2 border across all cortical layers and two parallel UMAP trajectories for V1 and V2 that bifurcated from the SP. Capture area, 6.5 x 6.5 mm. j, Spatial graphs showing additional genes identified by Visium exhibiting clear transition at the V1-V2 border. k, Imputed expression patterns for additional V1-V2 border genes matches with Visium results. l, Constellation plots of cell types in different cortical areas show V1 and V2 share a developmental lineage that is distinct with PFC. Matching nodes between V1 and V2 have connection fraction > 0.2 except for EN-IT-L3 and EN-IT-L4. See Supplementary Table 8. m, Gene ontology (GO) analysis reveals synapse and cell adhesion-associated biological processes are upregulated in V1-specific Layer 4 neurons. n, Heatmap for incoming signaling pathways shows neurexin (NRXN) signaling is specifically enriched in EN-IT-L4-V1 cluster comparing to other upper layer (UL) EN-IT clusters. o, Network heatmap shows EN-IT-L4-V1 is unique among upper layer EN-ITs to receive NRXN signaling from both IN and EN sources, leading to significant increase in overall interaction strength. The bar graphs on the top and right side are sum of interaction strength as incoming and outgoing signals, respectively.

