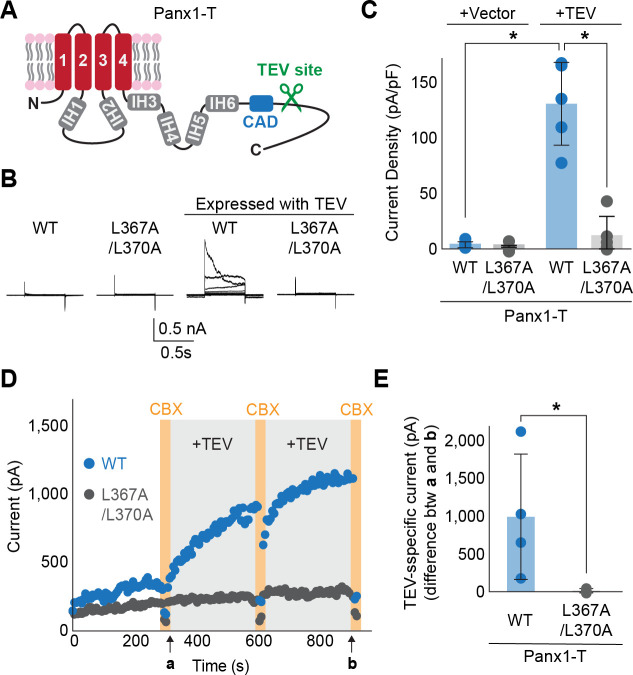
Figure 2. Enzyme-mediated C-terminal cleavage exposes the CAD.
(A) A schematic representation of the full length Panx1 harboring a TEV protease cleavage site instead of the caspase recognition site (Panx1-T). (B) and (C) Exemplar whole cell currents (B) and peak current density at +110 mV (C) of Panx1-T co-expressed in HEK293 cells with TEV protease. Cells were clamped at −70 mV and stepped from −110 mV to +110 mV for 0.5 s in 20 mV increments. N=4. Asterisks indicate significance of p<0.05 determined by student T-test. (D) Inside-out patch clamp recordings with or without recombinant TEV protease (0.1mg/mL). Voltage ramps from 130 mV to +80 mV over 0.5 s were applied every 6 s. Representative peak currents at +80 mV are plotted for Panx1-T (blue) and Panx1-T L367A/L370A (gray). CBX (100 μM) were applied at time points indicated by orange bars. (E) TEV specific currents defined as the peak current differences between the indicated time points a and b. N=4. Asterisk indicates a p<0.05 obtained from an unpaired student T-test.

