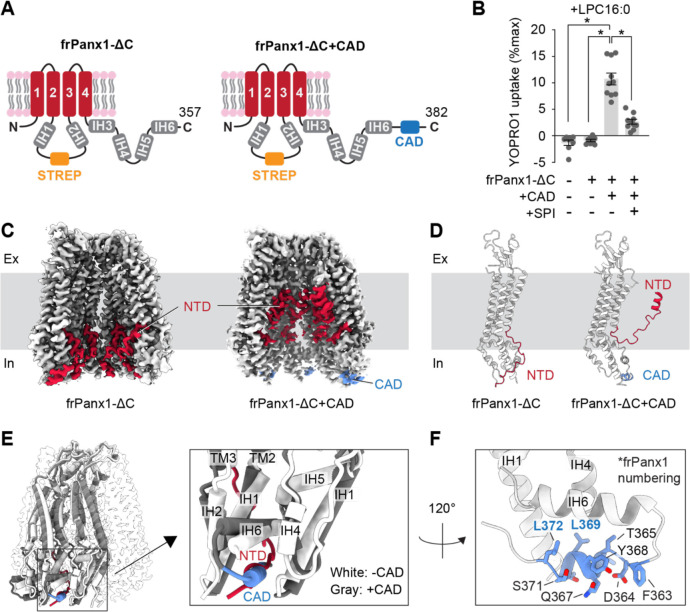
Figure 3. CAD promotes the NTD to flip.
(A) Schematic representations of frPanx1-ΔC (left) and frPanx1-ΔC+CAD (right). Residues between 171 and 179 were replaced with StrepII tag. (B) YO-PRO-1 uptake triggered by LPC16:0 (10 μM). YO-PRO-1 uptake from frPanx1 expressing Sf9 cells at 5 min are shown. N=10 and error bars indicate SEM. Asterisks indicate significance of p<0.05 determined by one-way ANOVA followed by Dunnett’s test comparing to frPanx1-ΔC+CAD. SPI; spironolactone (50 μM). (C) and (D) Cryo-EM structures of the frPanx1 constructs. Cryo-EM maps (C) and cartoon representation of a protomeric model of frPanx1-ΔC (left) and frPanx1-ΔC+CAD (right). EM densities for only four subunits are shown for clarity. (E) Superposition of frPanx1-ΔC (while) with frPanx1-ΔC+CAD (gray) highlighting that the NTD (red) and the CAD (blue) occupies a common binding pocket. (F) Close-up view of the frPanx1-ΔC+CAD model around the CBP.

