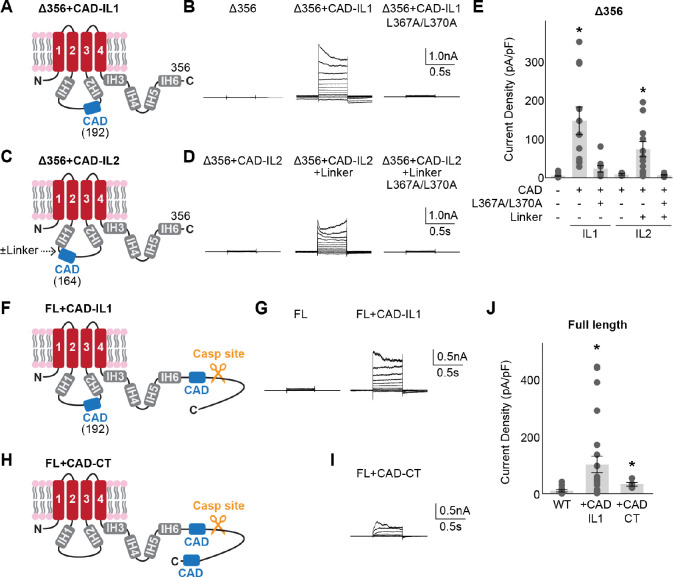
Figure 4. CAD can facilitate Panx1 activation from non-native positions.
Schematic representations ((A), (C), (F), and (H)), representative whole cell recordings ((B), (D), (G), (I)), and peak current density at +110 mV ((E) and (J)) are shown for each tested construct. HEK293 cells were clamped at −70 mV and stepped from −110 mV to +110 mV for 0.5 s in 20 mV increments. N=5–24 and error bars indicate SEM. Asterisks indicate significance of p<0.05 determined by one-way ANOVA followed by Dunnett’s test comparing the Panx1Δ356 (E) or Panx1 wild type (J) to each construct.

