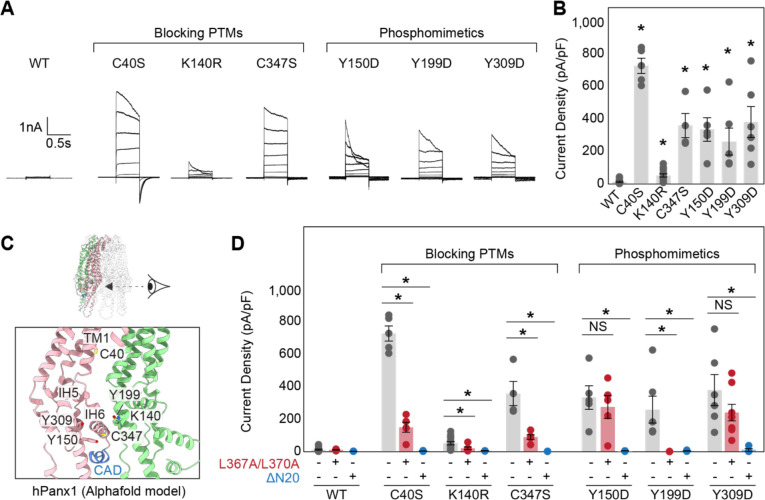
Figure 5. Point mutants blocking or mimicking PTMs potentiate Panx1 activity through CAD and NTD.
Exemplar whole cell patch clamp recordings (A) and peak current density at +110 mV (B) of the wild type and point mutants. Cells were clamped at −70 mV and stepped from −110 mV to +110 mV for 0.5 s in 20 mV increments. N=4–8 and error bars indicate SEM. Asterisks indicate significance of p<0.05 determined by one-way ANOVA followed by Dunnett’s test comparing WT to each construct. (C) Cartoon representation of the human Panx1 structure around the CBP. The AlphaFold model of human Panx1 was used due to missing side chains in the currently available cryo-EM structures. Only two subunits are shown for clarity. (D) Comparison of the peak current densities for wild type and each point mutant with or without L367A/L370A mutations or N-terminal truncation (2–20). N=4–8 and error bars indicate SEM. Asterisks indicate significance of p<0.05 determined by one-way ANOVA followed by Dunnett’s test comparing the parent construct with the L367A/L370A mutations and N-terminal truncation for each point mutation.

