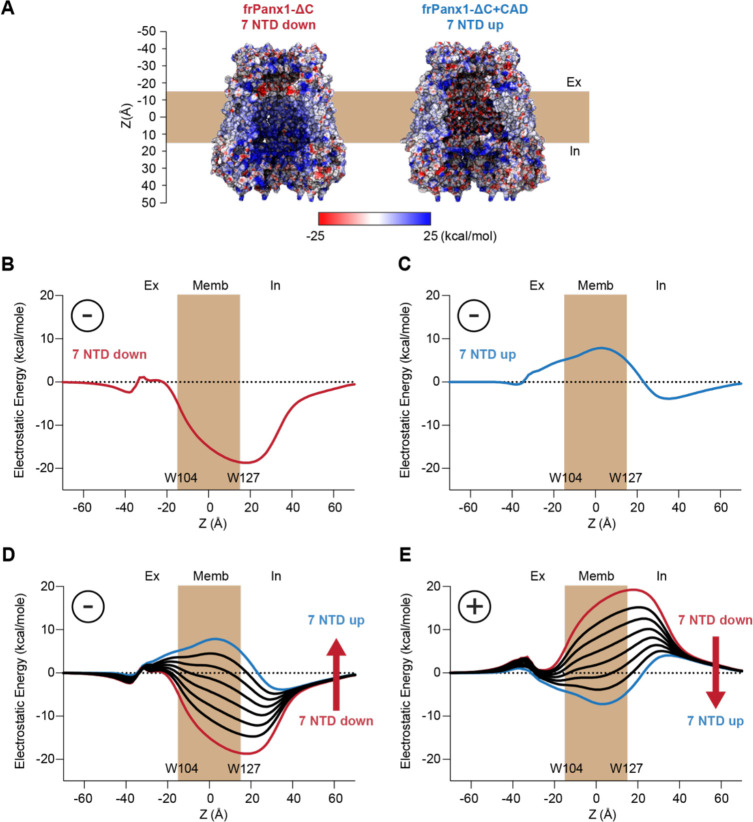
Figure 6. Electrostatic energy landscape controls ion permeation through the Panx1 channel.
(A) Electrostatic surface potential of a coronal section of the frPanx1-ΔC (left) and frPanx1-ΔC+CAD (right) ion permeation pathway. Electrostatic surface potential was calculated using the PBEQ module in CHARMM (1) and presented in the range between −25 kcal/mol (red: acidic) and +25 kcal/mol (blue: basic). Electrostatic contribution for an anion binding free energy (Etotal) along the permeation pathway (z=0 in the middle of predicted transmembrane) for the frPanx1-ΔC (B), frPanx1-ΔC+CAD (C), and hybrid models harboring 0–7 NTDs (D). (E) Electrostatic contribution for a cation binding free energy along the permeation pathway for the hybrid models. All calculations are carried out using the PBEQ module in CHARMM to solve the Poisson-Boltzmann solution of the system.

