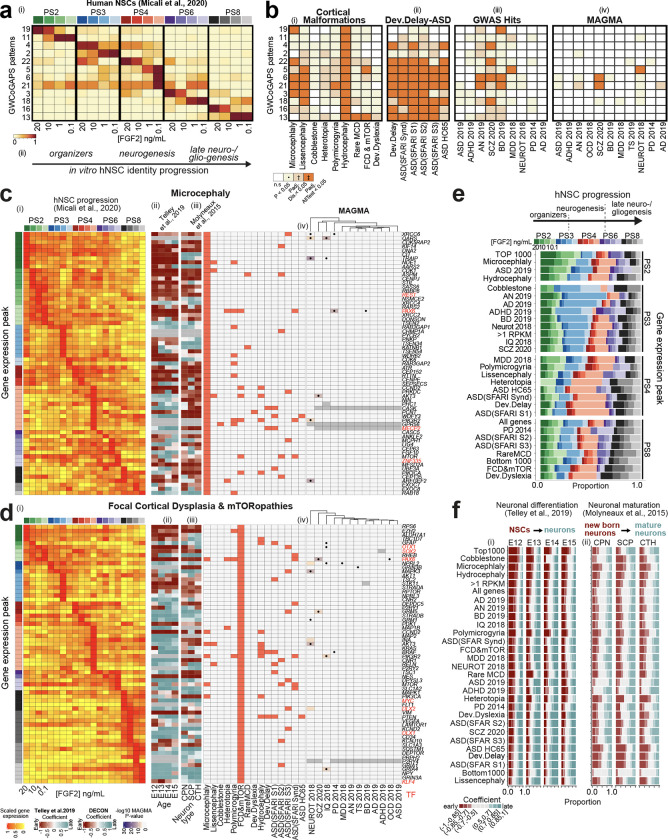
Fig. 1. Expression dynamics of risk genes across cortical neurogenesis.
a) Selected GWCoGAPS patterns dissecting hNSC progression across passages and FGF2 doses 40. (ii) Schema of hNSC progression. b) Enrichment of disease gene sets in the GWCoGAPS patterns. n.s.: not significant; P: uncorrected P-values at p<0.05; Padj.Dis: significance correcting by each disease independently; Padj. AllTest: significance after multiple-testing correction using the whole dataset. c, d) (i) Expression levels of risk genes in FGF2-regulated hNSC progression, ordered by the temporal peak of expression (left column colored by passage and FGF2 dose). (ii-iii) Slope of gene expression change across (ii) neuronal differentiation of age-specific RG cells and (iii) maturation of different neuronal classes from developing mouse cortex. (iv) Disease associations of each gene (left panel), and log10 p-value of the MAGMA gene-level test of association with each GWAS dataset (right panel). Black dots indicate a top-hit gene in the corresponding GWAS publication, based on genome-wide significant loci. e) Proportion of genes for each disease showing expression peaks at each passage and FGF2 condition. Additional categories: all genes in the dataset; genes with average expression of >1 log2 RPKM (RPKM>1); 1000 genes at the top and bottom ranks of expression, respectively (top and bottom 1000). Categories are ordered as: PS2 and PS3 high to low, PS4 and PS8 low to high. No diseases with most genes in PS6 were found. f) Proportion of genes classified in different bins of expression fold change in (i) differentiating NSCs and (ii) maturing neurons. Coefficient=slope of expression change as described in panels c and d.

