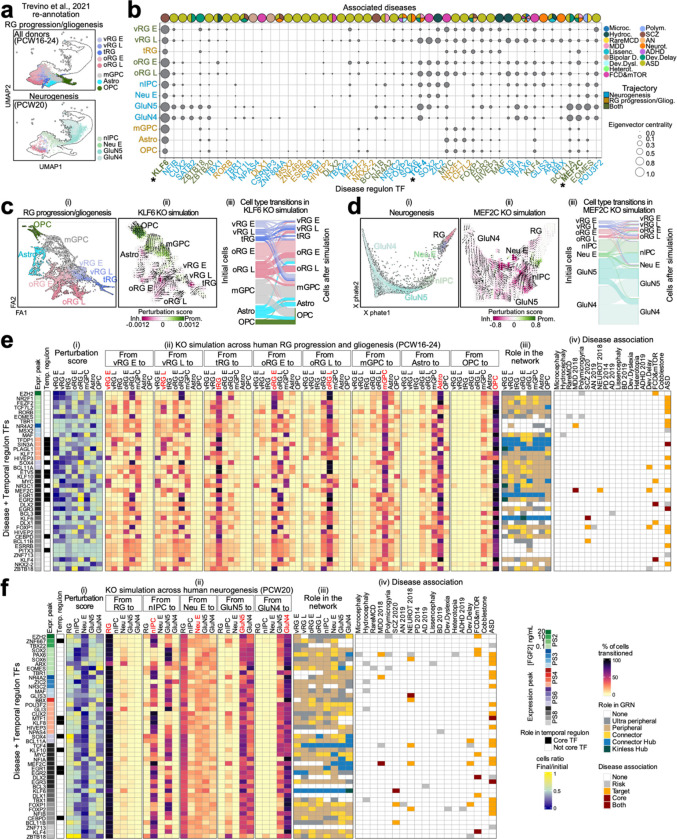
Fig. 4. In silico perturbation of regulon genes.
a) Trajectories from Trevino et al., 2021 analyzed in CellOracle: RG progression and gliogenesis for all donors (top); neurogenesis for each donor (bottom, only PCW20 is shown). b) Network centrality of disease-associated core TFs across RG progression, neurogenesis, and gliogenesis. The eigenvector centrality of a TF in the GRN of a cell type is shown by dots representing the influence of a gene in the network. Cell types (y axes) and TFs (x axes) are colored by the trajectory tested. The disease association of each TF is on the top bar. “*”: genes mentioned in the text. c, d) Partition-based graph abstraction (PAGA) map of RG maturation and gliogenesis (ci), and potential of heat diffusion for affinity-based transition embedding (PHATE) map of neurogenesis (di). KO simulation of (c) KLF6 and (d) MEF2C. ii) Trajectory perturbation: arrows simulate cell flow after KO perturbation with color representing trajectory change, promoted (green) or depleted (red). iii) Cell transitions from original cell identities (left) and after KO simulation (right). e, f) KO simulation of TFs across (e) RG maturation and gliogenesis and (f) neurogenesis. TFs associated with disease and core TF of temporal regulons, selected from the test in S10 are shown. Expression peak across the in vitro hNSC progression is next to each TF. Temporal regulon column shows core TFs in the temporal regulons. i) Perturbation score indicating gain or depletion of a given cell type. ii) Cell type transitions after KO simulations. Grids represent the fraction of the original cell type (labeled red on the top) and their final identity. iii) Regulatory role of every TF in each cell type. iv) Gene-Disease association, specifying core TFs and target genes in the disease regulons.

