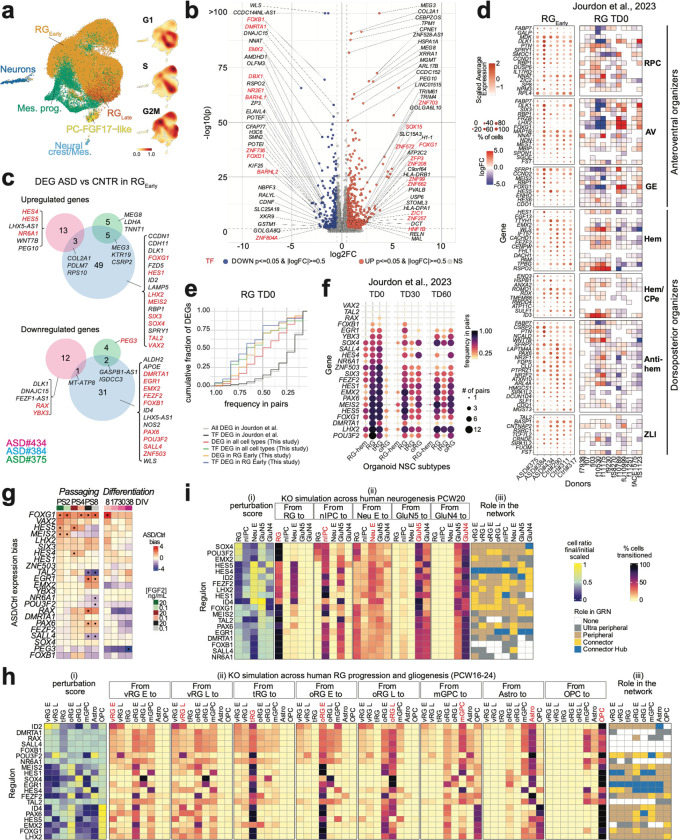
Fig. 5. Analysis of GRNs in ASD patient-derived NSC lines.
(a) Cell subtypes and density of the cell cycle phases, in control- and ASD-patient-derived NSCs. (b) DEGs between grouped ASD versus grouped control RGEarly cell pseudo-bulk. Fold change (FC) expression ratio between ASD and control cells (x axis) versus the significance of the differential expression (y axis). Top DEGs are labeled. (c) DEGs in RGEarly in individual ASD samples versus grouped controls. (d) Expression level (color gradient) and percentage of cells (dot size) expressing patterning center genes from Micali et al., 2023 in RGEarly of each line (left), and differential expression of the same genes across ASD-control organoid pairs in the RG cluster at TD0, from Jourdon et al., 2023. (e) Cumulative fraction of DEGs identified in our study (y-axis, grouped into different DEG subsets by color) found to be differentially expressed in varying frequencies among the ASD-control pairs in RG cluster at TD0 from Jourdon et al., 2023 34 (x-axis). Distribution for all genes/TFs differentially expressed in Jourdon et al. is given as reference (black/grey lines). (f) TFs differentially expressed in RGEarly in individual ASD samples (from c) also found significantly perturbed (upregulated or downregulated) in at least 1 ASD-control pair in the DEG data from Jourdon et al., in different NSC subtypes, at 3 organoid stages (dot size shows number of ASD pairs significantly perturbed, dot color shows frequency among total number of pairs tested), sorted by recurrence in RG cluster at TD0. (g) Expression ratio of TFs found in c across sequential passaging and differentiation of ASD versus Control NSCs. (h, i) CellOracle KO perturbation of differentially expressed TFs from panel c identified across (h) RG progression/gliogenesis (20 TFs tested) and (i) neurogenesis (19 TFs tested in PCW20). Perturbation score (i), cell type transitions (ii), role of every TF in each cell type (iii) as in Fig. 4.

