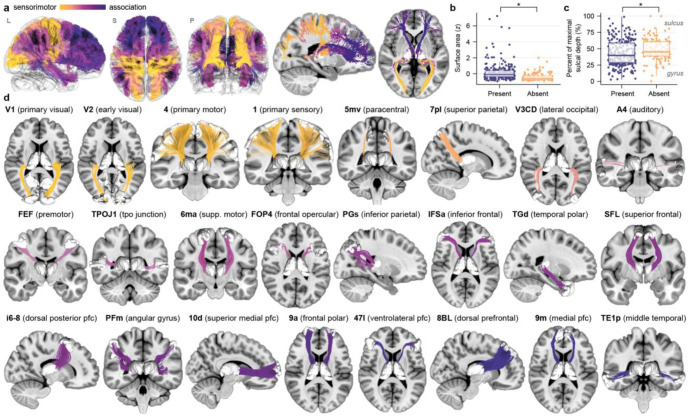
Figure 1. An atlas of regionally-specific thalamocortical structural connections.
a. All connections that constitute the population-level thalamocortical connectivity atlas are shown in lateral (L), superior (S), and posterior (P) 3D views as well as 2D slice views. Connections are colored by the cortical endpoint’s position along the S-A axis of brain organization. The thalamocortical atlas exhibits extensive connectivity with cortical regions that occupy positions along the breadth of the S-A axis. b. Cortical regions that do not have thalamic connections represented in the atlas (absent) had significantly smaller surface area than included regions, as determined by a spatial permutation based null. Surface area z-scores are plotted for cortical regions with connections included (present) versus not included (absent) in the atlas. c. Cortical regions absent from the atlas had significantly greater sulcal depth, as determined by a null distribution generated using spatial permutations. Represented regions were more likely to be located in gyral crowns (0% of maximal sulcal depth) than in the banks of sulci (100% of maximal sulcal depth). In c and d, box plots summarizing data distributions are included (center line: median, hinges: first and third quartiles, whiskers: 1.5x interquartile range). d. Exemplar regionally-specific thalamocortical connections included in the atlas are shown. Connections are arranged from lowest (V1; yellow) to highest (TE1p; dark blue) position on the S-A axis.

