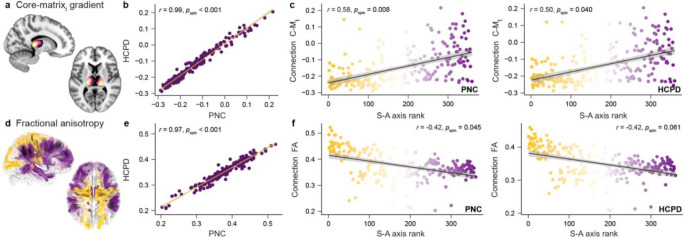
Figure 3. Identified structural connections reflect key features of thalamocortical circuit anatomy.
a. The core-matrix thalamic (C-Mt) gradient derived in prior work30 is shown in slices of the thalamus. Light yellow thalamic voxels were estimated to have the highest relative distribution of core neurons. Dark purple voxels were estimated to have the highest proportion of matrix neurons. b. We used the C-Mt gradient to assign each thalamocortical connection a value that indexes whether its streamlines terminated in thalamic areas with a higher percentage of core-like neurons (lower C-Mt values) or matrix-like neurons (higher C-Mt values). Connection-specific C-Mt values were nearly perfectly correlated between PNC and HCPD, serving as a general confirmation that delineated connections terminated in the same areas of the thalamus across datasets. c. Thalamic connection C-Mt values positively correlated with the sensorimotor-association (S-A) axis rank of the connection’s cortical partner in both PNC (left) and HCPD (right). Accordingly, both datasets showed evidence of core-to-sensory and matrix-to-association thalamocortical connectivity motifs. d. Thalamocortical connections are shown colored by mean FA (dark yellow: highest FA; dark purple: lowest FA; PNC data shown). e. Connection FA values were robustly correlated between PNC and HCPD, demonstrating that this structural connectivity feature is highly reproducible across youth samples. f. Thalamic connection FA values monotonically decreased along the S-A axis in PNC (left) and HCPD (right), revealing a continuum of connection strength and coherence that exhibits systematic hierarchical variation.

