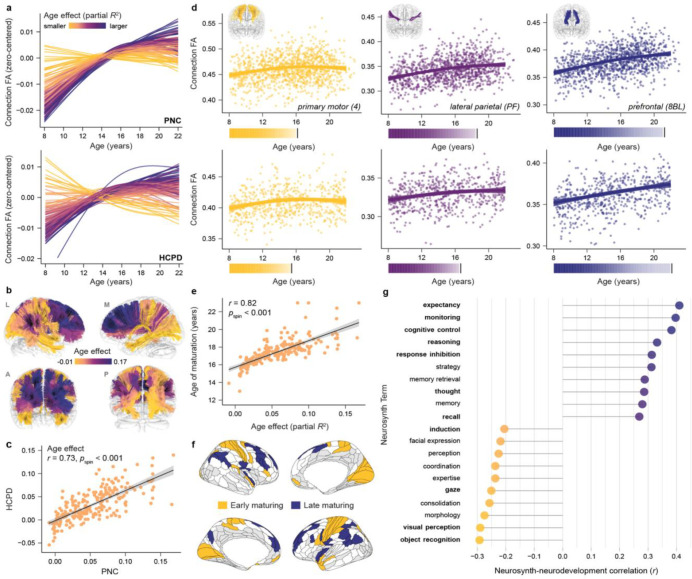
Figure 4. Charting variability in the magnitude and timing of thalamocortical structural connectivity development.
a. Fractional anisotropy (FA) developmental trajectories (zero-centered GAM smooth functions) are displayed for right hemisphere thalamocortical connections in PNC (top) and HCPD (bottom). Connections are colored by their statistical age effect (partial R2). A clear neurodevelopmental spectrum is observable in both datasets. b. Thalamocortical connections from the atlas are colored by their age effect (PNC data), revealing the brain-wide distribution of developmental heterogeneity. c. A correlation plot confirming close correspondence between connection-specific age effects derived in PNC and HCPD. d. Connection-specific FA trajectories that exemplify differences in the magnitude and timeframe of developmental change are shown, overlaid on participant-level data for PNC (top) and HCPD (bottom). Developmental trajectories represent GAM-predicted FA values with a 95% credible interval band. The corresponding color bars chart the rate of increase in FA during windows of significant developmental change and demarcate ages of connection maturation. e. GAM-derived age effects and ages of maturation were correlated in both datasets (PNC shown), revealing that the age of maturation metric provides insight into both the extent and timing of development. f. A brain map localizing cortical regions with the earliest maturing thalamic connections (age of maturation first quartile; yellow) and latest-maturing thalamic connections (fourth quartile; blue) is shown. White designates cortical regions with connections to the thalamus that matured in middle age quartiles. Light grey indicates regions with connections not included in the atlas. g. Results of an analysis that correlated the map of thalamocortical maturational age with psychological term maps from Neurosynth. Psychological terms associated with cortical regions that have thalamic connections that mature at the youngest ages (negatively correlated terms; yellow) and oldest ages (positively correlated terms; blue) are shown. PNC data is presented. Terms that were additionally included in the list of the 10 most negatively or 10 most positively correlated terms in HCPD are bolded.

