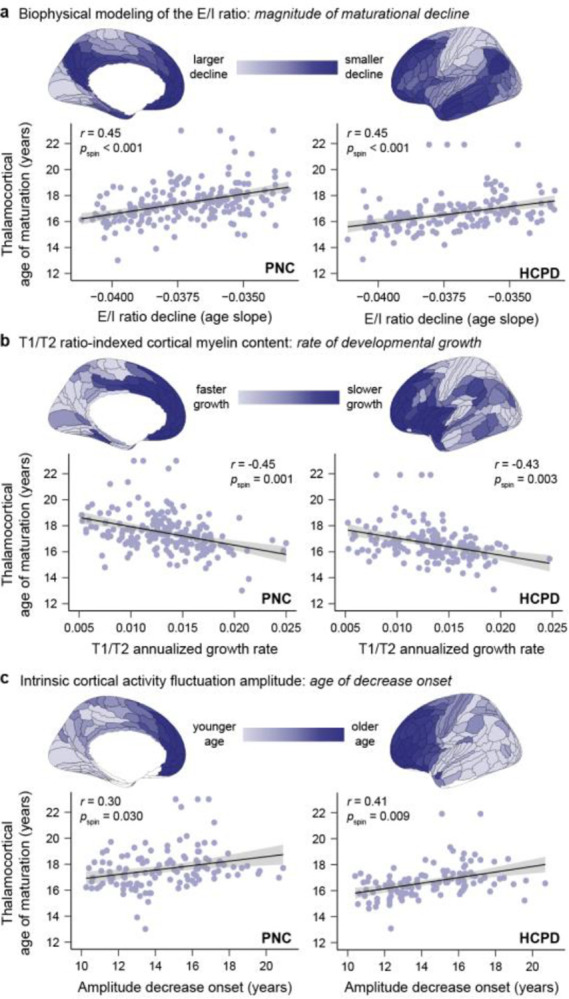
Figure 6. Thalamocortical structural connection maturation synchronizes with timescales of cortical plasticity.

Maps of thalamocortical connection maturation computed from PNC (left column) and HCPD (right column) diffusion data correlate with brain charts of child and adolescent cortical development. Cortical maps charting the development of E/I ratio (a), cortical myelin (b), and intrinsic activity amplitude (c) are shown. In all three cortical maps, darkest blue brain regions are those that express signatures of protracted developmental plasticity. a. Cortical regions with thalamic connections that mature at older ages undergo smaller age-related reductions in the E/I ratio during childhood and adolescence (less negative age slopes), implying that they remain in a relatively less mature, plasticity-permissive state for longer. E/I ratio was estimated in developmental data in Zhang, Larsen, et al.5 by applying a biophysically plausible circuit model to resting state functional MRI data. b. Cortical regions with thalamic connections that mature at older ages show a slower annualized growth rate of T1/T2 ratio-indexed cortical myelin content, suggesting that they experience slower maturation of a structural feature that restricts developmental plasticity. T1/T2 ratio development data is from Baum et al., 20224. c. Cortical regions with thalamic connections that mature at older ages exhibit later-onset declines in the amplitude of intrinsic activity fluctuations, indicative of temporally delayed reductions in a putative functional signature of developmental plasticity. The age at which intrinsic activity amplitude began to decrease in each cortical region was determined by Sydnor et al., 20232 through developmental modeling of age-related changes in BOLD fluctuation amplitude.
