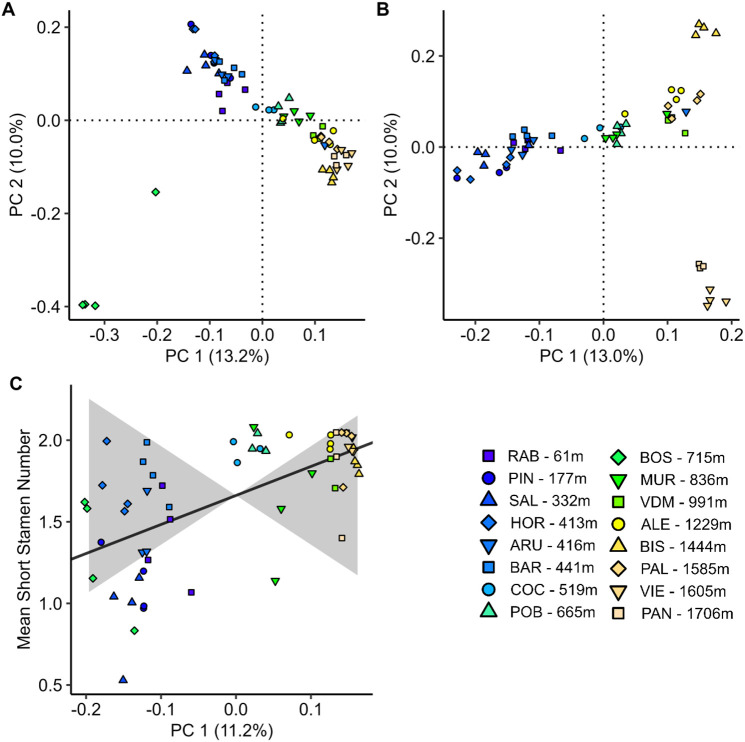
Figure 3: Genetic variation is correlated with elevation, but there is no evidence for divergent selection on short stamen number.
A) Genetic PCA for PC1 and PC2 from 1,858,706 SNPs. B) Genetic PCA for PC1 and PC2 with BOS individuals excluded. C) Qpc results showing the relationship between mean short stamen number and the greatest axis of genetic differentiation, PC1, (black line, p=0.26) is within expectations due to neutral evolution (grey shading), as were PC2-4 (see text). The fill color of each point represents the population elevation. Panels A and C used slightly different input data (see Methods).
Alt text: Graphs depicting genetic relatedness from genetic principal component analysis in panels A and B. In both panels, principal component 1 explains 13 percent of genetic variation and principal component 2 explains 10 percent. Panel C shows a positive relationship between mean short stamen number and principal component 1 but it is within expectations due to neutral evolution.

