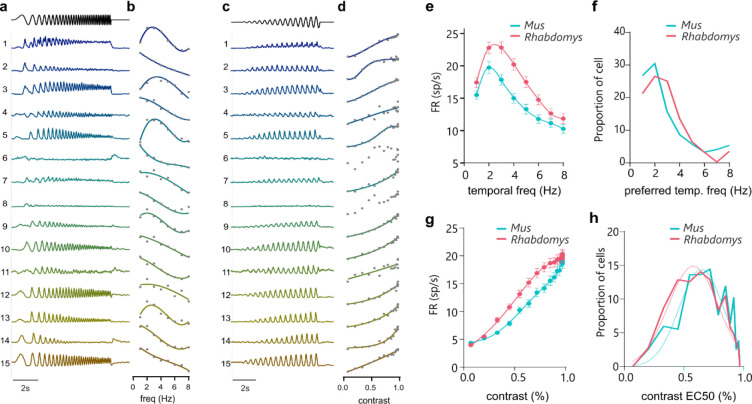
Extended data Figure 4. Temporal and contrast sensitivity of Mus and Rhabdomys.
a) Mean response profile of clusters 1–15 to increasing frequency sinusoidal stimuli. b) Response amplitude to increasing frequency sinusoidal stimulus, binned at a resolution of 1Hz, for individual clusters. Data shows mean, normalised response profile. c) Mean response profile of clusters 1–15 to increasing contrast sinusoidal stimulus. d) Response amplitude to increasing contrast sinusoidal stimulus, for individual clusters. Data shows mean, normalised response profile. e) Response amplitude to increasing frequency sinusoidal stimulus, binned at a resolution of 1Hz, for Mus (cyan) and Rhabdomys (red). Data shows mean+/− SEM. f) Distribution of preferred temporal frequency for Mus (cyan) and Rhabdomys (red). g) Response amplitude to increasing contrast sinusoidal stimulus, shown for Mus (cyan) and Rhabdomys (red); data shows mean+/− SEM. h) Distribution of C50 values (half-maximum of Naka-Ruston curve) for Mus (cyan) and Rhabdomys (red).

