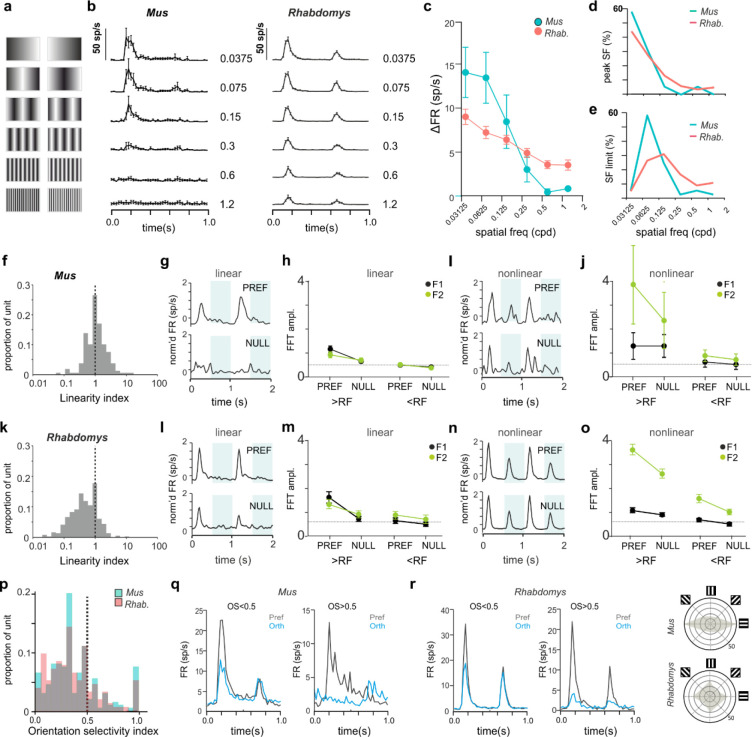
Figure 2. Spatial frequency tuning and linearity in Mus and Rhabdomys.
a) Schematic of inverting grating stimuli of increasing spatial frequency. b) Mean+/−SEM PSTH for 1Hz inverting grating stimuli at 6 spatial frequencies (0.0375, 0.075, 0.15, 0.3, 0.6, 1.2cpd) for Mus (left) and Rhabdomys (right) c) Amplitude of response to increasing frequency inverting gratings at preferred orientation/phase, shown for Mus (cyan) and Rhabdomys (red); data show mean+/− SEM. d&e) Distribution of % of neurons with peak response at a particular frequency (d); and with a threshold to response at a particular spatial frequency (e), shown for Mus (cyan) and Rhabdomys (red). f, Distribution of linearity index (LI) in Mus. g, Mean normalised response of linear neurons in preferred (top panel) or null (lower panel) phase, in response to 2 grating inversions. Shaded regions indicate inversions. h, fft amplitude in preferred and null phase of the response, for spatial frequencies greater than (left) or less than (right) the receptive field size, for F1 (black) and F2 (green) frequency components. i&j, as in g&h but for non-linear responses in Mus. k-o, as in f-j, but for Rhabdomys. p) Distribution of orientation selectivity index (OSI) for Mus. q&r) mean response of Mus (q) and Rhabdomys (r) neurons with OSI<0.5 (left) and OSI>0.5 (right) in response to inverting grating at optimal spatial frequency, in preferred (black) and null (red) phase. s, distribution of preferred orientation of bars for OS neurons (note double plot from 180–360⁰) for Mus and Rhabdomys (top and bottom panels, respectively).

