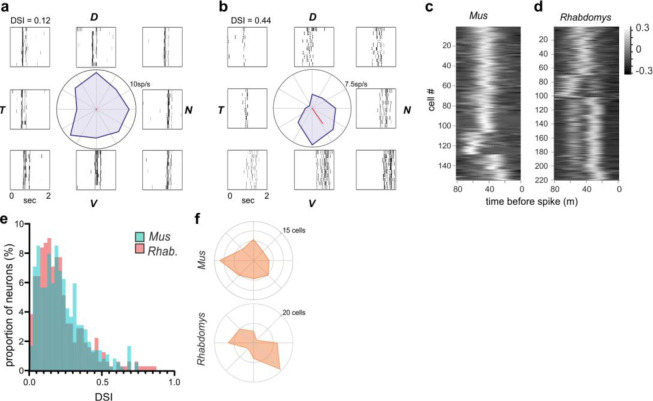
Figure 3. Direction selectivity and responses to motion.
a&b) Representative neurons from Rhabdomys with low (DSI = 0.12) or high (DSI = 0.44) DSI values. Polar plot in centre plots change in firing rate in each direction of motion, and rasters plots to side showing the response to repeated stimuli at each direction. Dorsal, ventral, nasal and temporal locations indicated by D, V, N and T. c&d) Heat maps show spike triggered average of luminance changes in the RF centre, as a function of time (−80ms – 0), for all neurons in which we were able to map receptive fields, in Mus (c) and Rhabdomys (d). e) histogram of DSI values for Rhabdomys (red) and Mus (cyan) dLGN neurons (Kolmogorov-Smirnov test: P=0.193) f), distribution of tuning preference for DS neurons in Mus (top) and Rhabdomys (bottom) with DSI > 0.33.

